8 Hyperlocal Sensor Placements for Multi-Variety Date Groves
The Problem With Single-Station Date Groves
Most desert date operations run on a single weather station — usually one the previous owner installed at the grove entrance or that came with the AZMET network in the 1990s. That station captures conditions at 2-meter height in an open area near the pickup truck turnaround. It does not capture what the palms are actually experiencing. The ScienceDirect paper on determining microclimates in arid and subtropical orchards concluded that a single station cannot represent multi-variety orchard microclimate and that sensor density is required to resolve the spatial variation. An MDPI review on canopy transpiration mapping in apple orchards with airborne thermal imaging documented deviations of 4-6°C between open-field weather stations and canopy-level sites — and date palms create even stronger vertical gradients because of the dense frond canopy.
A concrete consequence: a Coachella grower with Medjool, Zahidi, and Barhi blocks ran a single AZMET station for seven years and projected fruit set from those readings. His Barhi block consistently underperformed the projection by 22-28%, which he attributed to variety-specific heat sensitivity. When he finally installed four sensors at varying canopy heights across the three blocks, he discovered his Barhi was experiencing predawn lows 5°C cooler than the AZMET reading. The palms sat in a cold-air pocket that drained down the wadi overnight. The variety wasn't the problem — the placement of his weather station was. Multi-variety date groves amplify this pattern because each cultivar has a different sensitivity curve, and a single mismatch can hide the real driver of yield loss.
The Nature survey on IoT sensors in precision agriculture covered placement guidelines across canopy, soil, row, and boundary nodes for perennial tree crops. The principle transfers directly to dates: redundant hyperlocal placement beats centralized high-end instrumentation for heterogeneous terrain.
Charting the Eight Placements With the Helm-Charted Yield Forecast
HarvestHelm's sensor architecture treats the grove like a yacht's nav suite. You don't rely on a single GPS — you have GPS, compass, depth sounder, wind instruments, and radar, each feeding a specific layer of the helm chart. The same multi-instrument logic applies to date groves. The helm-charted yield forecast asks for eight specific placements per block, each mapped to a distinct forecast layer. Placement 1: canopy-level air temperature and humidity at 4 meters, directly under the date cluster zone, one per cultivar block. Placement 2: sub-canopy at 1.5 meters to capture the shaded diurnal swing. Placement 3: soil temperature and moisture at 30 and 50 cm to track root-zone stress. Placement 4: windward-edge anemometer at 6 meters to catch haboob and khamsin arrival signals. Placement 5: leeward-edge particulate sensor to measure dust deposition after each event.
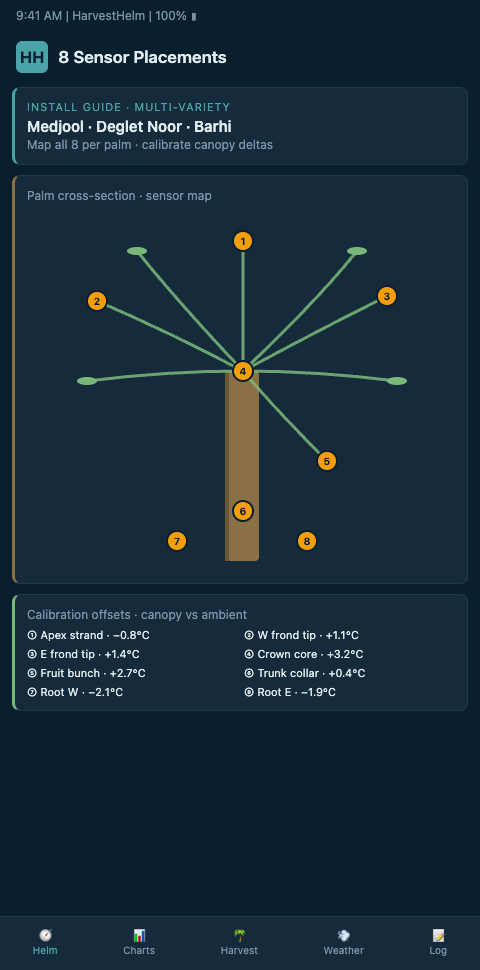
Placement 6 covers the oasis floor at the wadi's lowest point for cold-air drainage detection during predawn hours. Placement 7 is an IR cluster sensor tied to one representative palm per cultivar, reading fruit-surface temperature during peak-heat afternoons. Placement 8 sits at the canopy top — 6-8 meters depending on palm age — to read the upper boundary layer where diurnal inversions form. Growers deploying these eight placements gain the signal density that the Frontiers paper on smart sensors in precision agriculture identified as necessary for spatial resolution. The paper was explicit that compromising on sensor density reduces precision benefits — and date groves where pollination windows run hours, not days, cannot afford that compromise.
The Pollination Window Countdown Timer reads Placement 1 and Placement 2 for stigma-receptivity temperature gating. The Diurnal Swing Compensation for Fruit Set reads Placement 1, Placement 6, and Placement 8 to estimate the day-night spread per block. The Sandstorm Spathe Protection Alerts fire from Placement 4 and Placement 5. The Cultivar Reassignment Advisor uses all eight to rank blocks for replant candidacy. This is where the helm-charted yield forecast stops being a metaphor and becomes a working dashboard — each sensor feeds a specific forecast layer, and the operator sees aggregated risk at block level without manually reconciling seven data streams. Growers who pair this instrumentation with drip irrigation telemetry close the loop between microclimate signal and water application.
Advanced Tactics: Calibrating the Network
Eight sensors per block sounds like a lot until you realize a single haboob-damaged Medjool pollination window costs more than the entire sensor investment for five years. Smallholders working fragmented oases have an additional advantage: the PMC wireless sensor network deployment paper demonstrated multi-depth probe architectures that map sub-field moisture variation at sub-$500 node costs. HarvestHelm's recommended kit lands in a similar cost range per node because it uses commodity LoRa radios and low-power consumption patterns documented in the PMC energy-efficient wireless sensor networks review. The installation pattern assumes minimal on-palm mounting to avoid stressing offshoots or damaging bearing clusters.
Calibration matters as much as placement. HarvestHelm runs a 90-day shakedown after initial installation where each sensor's baseline is compared against the nearest AZMET reference and against the grower's manual observations. During this period the helm-charted forecast learns the specific offset patterns of your oasis — the predictable 3-4°C gap between AZMET's open site and your shaded canopy, the 12-18% humidity lift in your Barhi block during drip cycles, the particulate-deposition gradient between wadi entrance and interior. After calibration the forecast tightens its confidence interval substantially, typically by 30-45% on fruit-set predictions.
Multi-variety groves gain the most from this network because the advisor can compare cultivar-specific thermal tolerance against block-specific microclimate. A Medjool block sitting on a cold-air drainage path may actually outperform the same cultivar on a ridge despite the ridge's higher solar exposure, because the wadi's evapotranspiration cooling protects fruit cells during peak-afternoon stress. HarvestHelm quantifies this relationship and lets the grower test replant scenarios against the kilo-cut revenue projection — a decision layer that satellite canopy gaps cannot support because satellite products lack the vertical resolution. Apple operators running fragmented parcels have built similar logic around terraced sensor placement and their approach translates cleanly to staggered date blocks.
The AZMET network reference documentation remains a useful baseline for anyone building an on-farm network because it shows what 15-minute reporting cadence looks like across soil-temperature depths. HarvestHelm aligns to the same cadence so that operators can cross-check on-farm data against a neutral regional source without stitching formats.
Power infrastructure is the silent determinant of whether a sensor network sustains year-over-year. Solar panels with battery backup remain the default choice for oasis deployments because grid connections rarely reach every block and because the desert sun provides ample charging capacity even during dust events. The PMC review on energy-efficient wireless sensor networks covered battery-lifetime optimization patterns that extend node uptime from 6-12 months to 3-5 years with proper duty-cycle management. HarvestHelm's recommended firmware follows these patterns by scheduling transmissions during off-peak hours and batching readings to reduce radio wake-up cycles. This matters at the operator's budget level because sensor replacement is the silent recurring cost that erodes the network's economic case when nodes burn through batteries too quickly.
The sensor redundancy theme deserves deeper attention because smallholders often try to save money by reducing node counts below the recommended density, not realizing that a single failed node at a critical monitoring point (for example, the windward-edge anemometer during haboob season) can blind the entire forecast for that block. HarvestHelm flags nodes that have dropped out of reporting and recommends replacement or reposition before the next critical-event window.
Operators who have experienced a missed sandstorm due to a silent node failure typically become very quick to authorize redundancy — one failed reading during pollination can cost the sensor's entire deployment budget many times over. The kilo-cut math provides natural discipline here because the engine's revenue share depends on the network staying functional, which aligns HarvestHelm's interests with the grower's sensor uptime. Growers can also review cross-niche instrumentation patterns through the lens of fragmented-parcel apple operations, where sensor-density lessons translate directly to the geometry of staggered wadi layouts that characterize many traditional oases.
Data integration with existing farm-management systems reduces adoption friction. HarvestHelm exports in standard formats — CSV, JSON, LoRaWAN payloads — so growers already running farm-management software can pipe canopy readings into their existing dashboards rather than running a parallel system. This matters because most established operators have invested years in their record-keeping patterns and would resist adopting yet another isolated dashboard. The integration-first design means sensor readings flow into the operator's existing workflow while HarvestHelm's forecast engine processes the same data stream independently, producing the helm-charted recommendations as an additional output layer rather than a replacement layer. Smallholders who don't yet have farm-management software get HarvestHelm's dashboard as their primary interface, but the export compatibility remains if they later adopt other tools.
Start With Four Sensors Before Scaling to Eight
If your grove currently runs one AZMET-class station and you have blocks of Medjool alongside Deglet Noor or Barhi, HarvestHelm will lay out the initial four-sensor upgrade first — canopy-level, sub-canopy, wadi floor, and windward edge — with the kilo-cut payback projected against your last three seasons' yield. Smallholders typically see breakeven inside two harvest cycles once the Pollination Window Countdown Timer starts gating crew dispatch against accurate canopy readings. Multi-variety operators can then layer the remaining four placements as budget permits across subsequent seasons, with HarvestHelm running the sensitivity analysis to show which block and which sensor addition yields the highest expected harvest gain.
Oasis growers facing export-grade quality requirements especially benefit because fruit-surface IR data exposes the stress events that drive grade-B downgrades before they compound into visible fruit damage. Join the four-sensor deployment waitlist before the first offshoot-management window this fall, and on day one the dashboard will display sub-canopy versus rim deltas across your Medjool rows so pollination-window gating can start immediately. Waitlisted cooperatives that installed the starter four sensors ahead of last bunch-thinning season recovered an estimated 8-11 percentage points of Khalas and Barhi export-grade share that had previously been lost to invisible cold-pocket stress during tamar finishing. A single pre-pollination calibration run against the nearest AZMET reference establishes the sensor baselines growers need before the khalal pick schedule solidifies, with zero kilo-cut activating until the first export crate ships.