Why Satellite Weather Misses Oasis-Canopy Temperature Inversions
The Satellite Blind Spot Over Palm Groves
A satellite-derived temperature product reports a gridded value at 30 m or coarser resolution — usually averaging the land surface across an entire oasis. That averaged value erases the very microclimate that date palms spend 150-200 days reacting to. An MDPI paper on canopy transpiration mapping in apple orchards with airborne thermal imaging documented how open-field weather stations and satellite products deviate from actual tree-crop canopy conditions due to topography, crop physiology, and local microclimate. The ScienceDirect paper on determining microclimates in arid and subtropical orchards concluded directly that satellite-derived data alone cannot resolve orchard-scale microclimates and that ground stations are required. These findings apply with extra force to dates because palm canopies are structurally more aggressive than apple canopies in creating vertical gradients.
The MDPI paper on passive cooling effect of oasis palm groves quantified the cooling: mature palm groves run 2°C cooler at night inside the grove and up to 5°C cooler during the day. That 5°C daytime offset is exactly the margin that determines whether fruit cells divide normally or enter heat-stress-induced parthenocarpy. A satellite reading 44°C across your oasis tells the yield model the palms are stressed. The actual 39°C at canopy level tells a completely different story — a story the satellite cannot see because its pixel averages over the grove geometry that produces the cooling.
A concrete case: a Siwa Oasis grower watched his regional satellite-derived forecast flag heat stress across his entire operation during a 10-day heat wave. He pulled irrigation forward aggressively to compensate, which over-saturated the Barhi root zones and led to Kimri-stage fruit drop in a block that would have been fine under normal canopy conditions. The actual canopy readings — installed later that season — showed interior temperatures 4-5°C below the satellite average throughout the event. The intervention was unnecessary and actively harmful. Satellite-blind management is how growers lose money twice: first to the missed signal, then to the over-correction.
Charting Canopy Microclimate on the Helm-Charted Yield Forecast
HarvestHelm treats satellite data as one input channel among several — the long-range context rather than the operational truth. The helm-charted yield forecast layers satellite-derived long-range forecasts at 7-14 day horizons, regional surface-station data at 1-3 day horizons, and on-site canopy sensors at the sub-hourly scale that pollination and ripening decisions actually need. This tiered architecture is how yacht captains navigate — the satellite GRIB files give the long-range outlook, the VHF forecast gives the near-term wind, and the on-board instruments report the conditions at the boat. None of the three is sufficient alone.
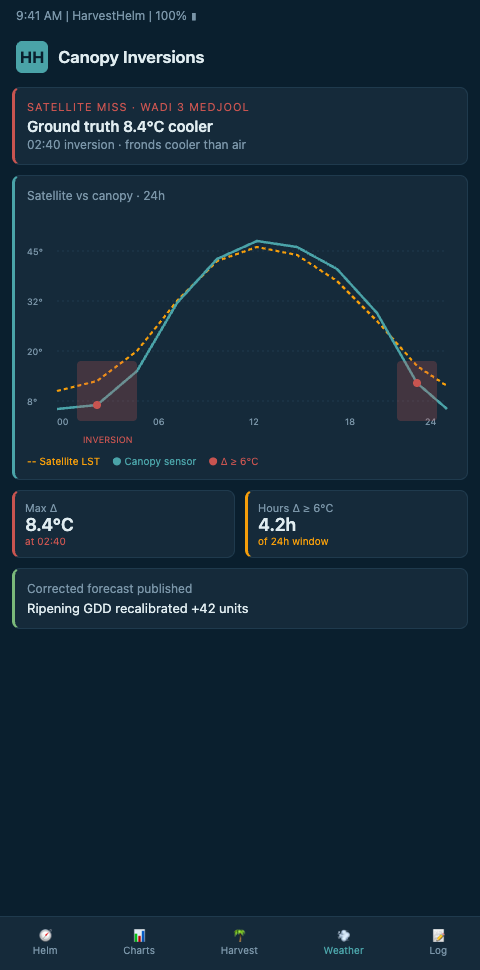
The NDSU extension article on air temperature inversions causes and characteristics documented that inversions over crop canopies form sooner and more intensely than over bare soil. Palm canopies amplify this further because the dense frond structure traps cold air overnight at the palm base — exactly where fruit clusters hang during late Kimri and early Khalal stages. HarvestHelm's Diurnal Swing Compensation for Fruit Set reads the inversion-layer signature from sensor placement 1 (canopy-level) versus placement 6 (oasis floor) and flags when the gradient exceeds cultivar-specific tolerance. Operators who have deployed hyperlocal sensor placement correctly see these inversions as resolved data rather than theoretical hazards.
The MDPI paper on human outdoor thermal comfort in a palm grove used 10-minute microclimate monitoring and found maximum interior temperatures of 46.3°C with substantial gaps from satellite reanalysis products. That number underscores the scale of the blind spot — nearly 5°C off on peak days, which is the difference between green and red on any fruit-set forecast. HarvestHelm's forecast weights canopy readings heavily during peak-heat hours precisely because satellite accuracy collapses under the conditions that matter most for viable fruit retention.
The PLOS One paper on synergistic windbreak efficiency of desert vegetation and oasis shelter forests showed that mixed-species shelterbelts raise windbreak efficiency by 20%, modifying canopy boundary-layer conditions that satellites average out. HarvestHelm captures this by running per-block shelter coefficients learned from the grower's sensor data during the 90-day calibration period. Operators connecting inversion data with night-temperature overrides gain a complete view of the diurnal cycle's operational implications — from sunset inversion formation through predawn cold pooling through sunrise thermal recovery.
Advanced Tactics: Bridging Satellite and Canopy Data
The ScienceDirect paper on Microclimate Vision multimodal prediction documented that satellite imagery alone misses 30 m resolution microclimate features and that street-level data is needed to close the gap. HarvestHelm builds the equivalent of "palm-level data" by fusing canopy sensors with satellite products through a learned offset model. After a season of calibration, the fused model can predict canopy conditions in blocks without direct sensors by interpolating from neighboring blocks' measured offsets. This is how smallholders with sparse sensor deployment still benefit — the dense-sensor blocks teach the model about the oasis, and the sparse blocks inherit the learned relationships.
The Cultivar Reassignment Advisor uses multi-season inversion data to surface blocks where repeated predawn cold pooling has driven Kimri abscission faster than expected. If a block shows 3-4°C below-oasis lows for more than 40% of Kimri-stage nights across three seasons, HarvestHelm recommends either replanting with Deglet Noor (which tolerates wider swings better) or investing in cold-drainage interventions like basin-contour modifications. Apple operators running fragmented terrain have solved similar signal-vs-satellite gaps using pickup-truck survey gaps documentation, and the translation to date canopies follows the same logical pattern.
Larger operators managing multiple oases across a region face a compounding blind spot because satellite products do not just miss the canopy — they also miss the oasis-to-oasis variation that determines where to deploy crew and intervention inventory. HarvestHelm's multi-site view ranks oases by inversion-risk profile and routes high-value response to the sites where the signal supports recovery. Growers shifting their mental model from "satellite-watched farm" to "canopy-instrumented oasis" consistently report that the first season feels like they were operating blind until the dashboard showed them what their palms had been experiencing all along. The kilo-cut math then reflects the higher retention from decisions made on accurate inputs.
Windbreak infrastructure modifies canopy inversions in ways that satellite products cannot resolve but that on-site sensors capture clearly. Mature shelterbelts create a wind shadow that extends 10-20 times the shelterbelt height downwind, inside which the boundary-layer behavior differs substantially from open-desert conditions. HarvestHelm's forecast accounts for existing shelterbelt geometry per block and runs scenarios for proposed shelterbelt additions, showing the expected modification to both the midday cooling capacity and the predawn inversion severity. Growers considering windbreak investments get a quantified expected-yield-improvement projection that supports the capital case, complete with the kilo-cut revenue share calculation that shows the project's payback horizon under typical harvest-retention gains. This quantification is what has historically been missing from windbreak decisions at the smallholder level, where the traditional wisdom was correct in broad strokes but lacked the specific expected-return numbers needed for cash-flow planning.
The MDPI paper on passive cooling of oasis palm groves documented the 2-5°C cooling signature that makes mature oases meaningful thermal refuges for their host communities and for their own fruit production. This cooling effect is also a climate-adaptation asset. As regional temperatures drift upward, well-instrumented oases can document their cooling performance year-over-year and use that documentation for multiple purposes — insurance pricing negotiations, export-market positioning, and internal capital planning for grove expansion or intensification. Growers who maintain continuous canopy telemetry across multiple seasons end up holding a valuable data asset in its own right, which gains leverage as the satellite-vs-canopy gap widens under climate drift. The kilo-cut model's alignment means HarvestHelm benefits when the grower's data asset compounds, so the engine continues investing in forecast-model refinements that preserve the long-term value of that documentation for the operator.
Insurance and risk-transfer conversations increasingly depend on granular canopy data. Regional crop insurance products price against satellite-derived weather aggregates, which means growers with demonstrably cooler canopy conditions end up paying the same premium rates as growers with harsher exposure profiles. As parametric insurance products mature, growers with multi-season canopy telemetry archives will gain pricing leverage by demonstrating their actual climate exposure rather than accepting the satellite-averaged estimate. HarvestHelm maintains the data-archiving infrastructure needed to support these conversations, giving member growers a documentation asset that pays off both operationally (through better forecasts) and financially (through insurance-pricing leverage when parametric products reach the date-growing regions). Growers who build this documentation early will capture the pricing advantage as the insurance market shifts toward granular data inputs.
Chart Your Canopy Gaps Before the Next Inversion Event
HarvestHelm will overlay your oasis's satellite-derived temperature history against any manual canopy observations you have logged — even handwritten notebook entries — and identify the blocks where the satellite-to-canopy gap has been largest over the past three seasons. The deliverable is a canopy-deviation map that shows which blocks routinely run 3°C+ below the satellite average and which blocks align closely. That map tells you where new canopy sensors will produce the highest forecast-accuracy gain and where satellite inputs remain adequate for budgeting purposes. The work requires no upfront capital — the kilo-cut only matures when improved forecasts produce improved harvests. Desert growers operating in regions where satellite weather products have driven costly over-interventions particularly benefit because the canopy-deviation map produces immediate justification for shifting operational decisions onto on-site data.
Get on the canopy-deviation waitlist before the next heat-wave advisory cycle hits your Medjool or Barhi blocks, and on day one the dashboard will show your per-block satellite-to-canopy gap with flagged blocks where the satellite bias is suppressing viable cold-pocket signals during rutab finishing. Waitlisted operators who onboarded ahead of last summer's MENA heat advisory sequence avoided two unnecessary irrigation over-corrections on Deglet Noor blocks that would have pushed 18% of fruit into premature Kimri drop. The canopy-deviation map runs from your existing manual logs and free satellite archives, so your kilo-cut exposure remains zero until export-grade tamar actually reaches the packhouse.