Why Pickup-Truck Crop Surveys Miss 60% of Mountain Orchard Risk
What the Windshield View Cannot See
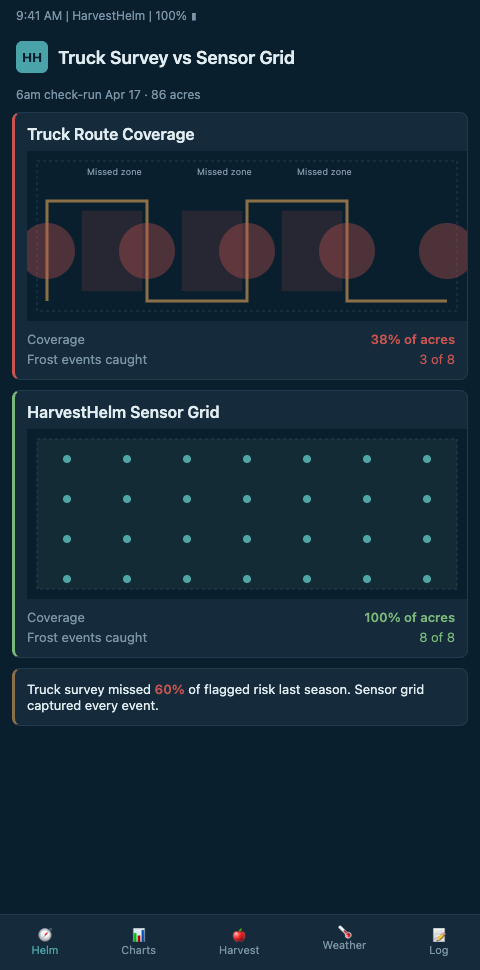
Springer's Agrosense AI orchard monitoring research documented a 515% speed gain over manual phenotyping when AI-enabled sensor systems replaced human scouts. That number is not about pace — it is about coverage. A pickup-truck survey walks or drives a small fraction of the orchard and records what the human eye catches from that vantage. On a 110-acre mountain orchard, the truck covers maybe 10% of the canopy surface area, and it records zero canopy-internal microclimate data. That is the 60% figure this post is named for: a conservative estimate of the risk surface that pickup-truck surveys systematically miss.
Good Fruit Grower's reporting on sensor overload covered a Washington Gala block running 66 sensors — and even that network exposed gaps no manual scout could catch. The point is not that 66 sensors are right; the point is that manual scouting cannot match sensor-grid resolution at all. The Scientific American coverage of climate change and apple harvest reinforces the stakes — climate-driven risk events are accelerating faster than manual inspection schedules can detect. A two-week scouting rotation catches nothing when the critical event happens over six hours at 3 a.m. on a calm April night.
Mountain terrain amplifies the coverage gap. On a flat orchard, a well-run scout can cover a quarter of the canopy per visit. On mountain terraces with steep access roads and fragmented parcels, the same scout covers less than half that — because access time eats into observation time. Growers whose blocks are spread across a 400-foot elevation range and three separate parcels are effectively scouting one-tenth of the canopy per week. The 60% figure is conservative for that terrain type.
The CropLife outlook on precision ag scouting tools documents the industry shift: scouting is evolving beyond human-limited manual inspection because the variance that matters is happening at a scale humans cannot cover. Mountain orchards are the extreme case of this pattern. Elevation bands, aspect differences, terrace geometry, and frost pocket behavior produce variance that no drive-by survey can capture, no matter how experienced the scout.
Replacing the Windshield With a Helm Display
A yacht captain does not navigate by looking over the bow. They navigate by reading the helm display — sonar, wind, current, chart — because the bow view is a small slice of the information that keeps the hull off the rocks. Mountain apple scouting needs the same shift. A helm-charted yield forecast replaces the windshield with a dashboard layered with canopy-height probes, drainage-map telemetry, and block-by-block forecasting. HarvestHelm builds that display specifically for mountain orchards where the windshield view is the least useful it gets.
Start with canopy-height temperature and humidity probes. A pickup-truck scout reading dew on leaves at 7 a.m. is capturing one moment in one block. A canopy probe logging at minute resolution captures the overnight inversion strength, the duration of sub-freezing exposure, and the recovery rate — all of which shape frost damage more than any morning visual. Research in Springer's UAV orchard management survey confirms UAVs and sensors capture monitoring tasks that are impractical for ground-based scouting, not because ground scouting is lazy, but because it is physically limited.
Next, layer UAV thermal flyovers. The Frontiers review of UAV orchard monitoring documents how UAV imaging captures tree-level data manual methods miss. One thermal flight pre-bud-break maps frost pocket boundaries across 40 acres in under 20 minutes — work that would take a scout two full days and still produce lower-resolution data. Integrate the flyover data into your dashboard so the scout team is deployed to the specific blocks where sensor or thermal data flags a problem, not driving the whole orchard looking for one.
Third, add bloom phenology and canopy stress layers. Farmonaut's drone field scouting research shows drones scan entire fields in minutes, delivering multispectral data that manual scouts cannot capture. That multispectral layer shows water stress, early disease pressure, and canopy density variance — signals that shape thinning and harvest decisions. HarvestHelm pulls these data streams into one display so the grower acts on integrated signals, not isolated drive-by notes. For growers building the probe network that feeds this, the sensor placement rules walkthrough covers the placement discipline that makes scout-replacement actually work.
The time-coverage math is stark. A pickup-truck survey on a 110-acre mountain orchard typically takes 4-6 hours and produces a snapshot. In that same window, a probe network captures 240-plus minutes of data per probe across 30-plus probes. That is over 7,200 data points per window versus maybe 200 observations a scout records. The data density difference is where the 60% coverage gap originates, and it compounds through the season as the scout visits decline and the probe network keeps logging.
Running a proper sensor coverage audit after late spring freeze events is how you confirm your sensor network caught what the truck would have missed. The first season's audit is where growers realize how much the pickup-truck view was leaving out.
The sensor-first dashboard is how HarvestHelm builds a helm-charted yield forecast specifically for mountain orchards: probe telemetry feeds the frost map, the bloom forecast, the thinning window, and the harvest projection, all visible on one display. The pickup-truck approach can feed none of these at the resolution the decisions require. Even where the scout catches a signal, by the time the observation makes it into the decision log, the window has often closed. Sensor data enters the dashboard as it happens.
Advanced Tactics: What Scouts Still Do Better
The sensor-first model does not eliminate scouts — it re-purposes them. Human scouts are still better than sensors at pattern recognition in specific situations: fire blight strike detection, unusual deer or bear damage, unexpected disease pressure, and irregular fruit set after a weather event. The sensor network flags the block; the scout confirms the cause. That division of labor is what makes the whole system work.
The most common mistake in moving off the windshield model is installing sensors without changing the scouting workflow. Growers end up paying for both, because they still drive the orchard on the old schedule. Change the schedule. Sensors should drive scout deployment — not the other way around.
The second mistake is trusting one sensor type. A temperature probe alone does not replace a scout; a temperature probe plus humidity plus soil moisture plus UAV thermal plus multispectral does. Build the stack. Good Fruit Grower's sensor-overload reporting is a reminder that more sensors without integration creates noise, not coverage.
Third advanced tactic: cross-reference the scout-miss pattern against adjacent crop systems. Tropical mango growers run into the exact same problem with rain-gauge canopy failures — regional weather data and drive-by surveys both miss the canopy-internal moisture that actually drives disease. The failure pattern is identical; the fix is sensors plus integrated dashboards.
A fourth tactic: run the sensor-plus-scout integration as a parallel-trial season before retiring the pickup-truck approach entirely. For one year, have scouts log observations and the sensor network log telemetry independently, then compare the event detections against verified damage at harvest. The parallel trial builds confidence in the sensor network and identifies the specific gaps where human observation still earns its keep. Growers who skip the parallel trial often either over-trust sensors in year one or never transition off the truck. The trial is the bridge.
A fifth tactic: factor in the opportunity cost of scout time. An experienced orchard manager doing drive-by surveys four mornings a week is 16 hours of the most expensive labor on the property spent on coverage work that sensors handle better. Those hours redirected to block-level decisions — deciding when to fire wind machines, which thinning crews to deploy where, how to schedule pollinator placements — are where the expert's judgment actually creates value. Sensors free the expert from coverage duty.
A sixth tactic: quantify the scout-miss events after they happen. Every time the orchard experiences a yield surprise — a frost loss larger than expected, a disease outbreak detected late, a thinning window missed — log whether a probe network would have caught it earlier. Over two seasons, that log becomes the justification for the sensor-first shift. Growers who keep the log often find 3-5 events per season where early sensor detection would have saved meaningful bins. That data is more persuasive than any vendor sales pitch.
A seventh tactic: integrate the sensor data with the decision log so every alert is tied to the action taken and the outcome observed. Over three seasons, the log becomes training data for smarter alert calibration — and for better scout deployment, since the remaining human observations become more targeted.
Stop Driving the Risk You Cannot See
Mountain apple growers on multi-elevation parcels should end the pickup-truck-as-risk-model era this season. HarvestHelm installs the sensor and UAV-flyover stack on your Honeycrisp, Gala, and Fuji blocks, integrates it with scout-deployment workflows, and takes a kilo-cut only on cleared packhouse tonnage. You stop paying to drive what you cannot see and start acting on what the probes actually detect. For brokers and packhouse operators working mountain supply, the improved risk visibility flows through to tighter supply agreements and fewer emergency storage events. The onboarding workflow starts with a parallel-trial season where sensors and truck scouting run side by side, so the orchard manager can see the exact events the windshield view missed before retiring the old schedule.
Day-one dashboards surface the canopy-height probe map alongside the UAV thermal flyover overlay, with block-level alerts calibrated to the decisions that actually move bins — frost protection, thinning, and early disease detection. Pilots signing before April get a scout-deployment rewrite that routes the orchard manager's 16 weekly hours from coverage duty to block-level wind-machine and thinning calls, where the expert judgment is worth the most. The kilo-cut contract ties explicitly to the bins that clear the packhouse scale on Honeycrisp, Gala, and Enterprise blocks once the sensor-first workflow is running, so the sensors only pay us after they stop a pickup-truck miss.