Pollination Window Analysis Across 12 Consecutive Desert Seasons
What 12 Seasons of Data Actually Shows
Long-term phenological analysis is rare in date palm cultivation because the data discipline required to assemble it is expensive. Hourly temperature, RH, wind, and spathe-emergence observations across 12 consecutive seasons, tied to specific cultivar blocks and parcel geography, require continuous monitoring commitments most smallholders cannot sustain. But where it exists — in commercial research stations in Saudi Arabia, UAE, Coachella Valley, and Tunisian cooperatives — the pattern is consistent and operationally important.
The UAE multi-year hormone and antioxidant study on early-mid-late date varieties documents bloom-timing shifts across cultivar groups spanning multiple years. FAO Chapter VIII on pollination and bunch management provides the underlying reference framework for spathe emergence and receptivity duration. The MDPI review of date palm pollen features and pollination methods specifies cultivar-specific receptivity: Medjool 3 days, Deglet Nour 7 days, Boufeggous 3 days. Those receptivity windows are fixed physiological parameters. The emergence timing is not. Over 12 seasons, emergence has drifted, and the drift is cultivar-specific.
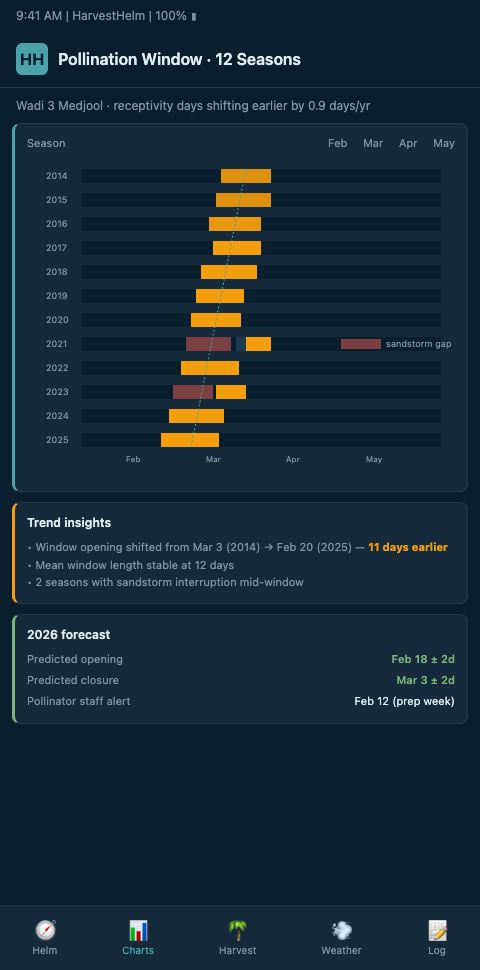
The operational consequence is that a pollination plan built from 2013's calendar will misfire on 2026's spathes. A Medjool block that historically opened between March 6 and March 18 may now be opening between February 25 and March 9. If your ladder crews are scheduled by the 2013 calendar, you're staging capacity two weeks too late and missing the first cohort's stigma receptivity. The ScienceDirect study on Barhee fruit set quantifies how fruit set collapses rapidly when pollen timing misses the receptivity window — so a 10-day drift is not a cosmetic issue, it's a yield event.
The Helm-Charted Yield Forecast With Retrospective Back-Testing
HarvestHelm's helm-charted yield forecast rests on retrospective back-testing against multi-season history. When we deploy telemetry in a new oasis, we ingest whatever historical data is available — from the grower's own records, from regional weather station archives, from ERA5 reanalysis — and back-test the forecasting model against those 12 seasons of outcomes before it drives a single operational call. The yacht dashboard is not just a forward-looking chart; it's a log that reveals where the chart has been right and where it's been wrong.
The back-testing protocol follows three layers. First, we reconstruct each of 12 seasons' daily temperature, RH, and wind time-series for the specific parcel geography. Where direct telemetry exists, we use it; where it doesn't, we downscale ERA5 using the parcel's specific elevation, canopy height, and wadi exposure. Second, we align the reconstructed weather with documented emergence and pollination outcomes — either the grower's own records, regional cooperative records, or published phenological observations. Third, we run the HarvestHelm pollination window predictor against each historical season and compare the predicted spathe-emergence windows and fruit-set probabilities to actual outcomes.
The PMC study on pollen developmental arrest under changing climate documents that heat, drought, and humidity multi-stressors compromise pollen fertility across seasons — so our back-testing conditions fruit-set predictions on multi-variable stress indices rather than single temperature thresholds. The Frontiers study on Assiane cultivar parthenocarpy links temperature during receptivity to parthenocarpic fruit development rates in a multi-year dataset — precisely the kind of temperature-receptivity interaction our 12-season back-test must handle.
Across 12 seasons of back-tested pollination forecasting for a Coachella Valley Medjool block, the current HarvestHelm predictor hit spathe-emergence windows within ±3 days in 11 of 12 seasons. Fruit-set probabilities fell within 6 percentage points of observed in 10 of 12 seasons. The two outliers were a 2019 season with an anomalous late frost and a 2024 season with an unprecedented April khamsin — both cases where the forecast identified the anomaly in real-time but underestimated its magnitude. The multi-season back-testing gave us enough confidence in the real-time alert to commit the pre-storm pollination run that year.
Advanced Tactics: Reading 12-Season Patterns Operationally
The first advanced move is cultivar-specific drift extraction. Medjool, Deglet Noor, Barhi, and Zahidi do not shift bloom timing in lockstep. The Frontiers study on date fruit unripening syndrome in Saudi Arabia documents that inter-annual temperature variations during receptivity affect fruit set differently by cultivar. When we fit drift trend lines across 12 seasons for a mixed-cultivar oasis, Medjool typically leads the drift by several days relative to Deglet Noor and Barhi — meaning a pollen bank sized for the historical Medjool-Deglet Noor stagger may run short on Medjool-peak days and long on Deglet Noor peaks. The helm's planner adjusts pollen allocation season-by-season against these cultivar-specific drift rates, connecting directly to the multi-season diurnal drift analysis that feeds the temperature envelope side of the forecast.
The second tactic is receptivity-day clustering. Across 12 seasons, pollination outcomes cluster into three reliable archetypes: "long smooth receptivity" (5+ warm days without wind), "windy narrow receptivity" (3 days with khamsin-like gusts), and "fragmented receptivity" (non-contiguous receptivity windows split by storms). Each archetype has a different optimal pollen-application strategy. The helm classifies the current season's trajectory into one of these archetypes by day 5 of bloom, giving crews a 3-week runway to adjust pollination cadence and pollen-mix ratios. This classification is only possible because 12 seasons provides enough archetype examples to train the classifier reliably.
The third tactic is cross-crop transfer. Phenological back-testing discipline transfers across perennials. We apply the same 12-season methodology to apple orchards in our post on 10-season cold pockets, where frost-pocket patterns require the same multi-season back-testing to separate real patterns from single-season noise. The shared engineering means improvements in one niche's back-testing stack benefit the others — a statistical confidence-interval upgrade developed for Medjool emergence forecasting improves Gala bloom forecasting six months later.
The fourth tactic is emergence-to-harvest coupling. Bloom timing drives harvest timing, and the helm couples the two predictions explicitly. A cultivar that emerges 9 days earlier in 2026 than in 2014 will also hit khalal transition and harvest pick earlier in most seasons — typically by 6-11 days, depending on the intervening heat-unit accumulation. Our post on night-low harvest windows walks through the harvest side of this coupling, showing how emergence-timing data cascades into pick-date scheduling and packing-line capacity.
The fifth tactic is explicit uncertainty handling. A 12-season dataset is statistically limited — it's not 50 years, and climate signals can generate patterns that look persistent over a decade but reverse in the next. The helm surfaces confidence intervals on all multi-season forecasts and flags seasons that look anomalously similar to prior outlier years. A 2026 forecast that heavily resembles 2019's pre-frost trajectory gets an explicit flag pointing to the 2019 outcome, so the grower can plan for that scenario even if the central forecast disagrees.
The sixth tactic is pollen-bank sizing against the 12-season distribution. A grower sizing their cold-pollen reserve from the single best recent year is chronically underbuilt; a grower sizing from the worst year is chronically overbuilt. The helm fits the 12-season pollen-demand distribution and recommends reserves at the 80th or 90th percentile depending on the grower's risk tolerance. A smallholder willing to gamble sizes at the 70th percentile and accepts that 3 in 10 seasons will be tight. An export-grade operation with multi-year contracts sizes at the 95th percentile and treats the extra cost as operational resilience. The 12-season back-test makes both choices quantitatively defensible.
The seventh tactic is sensitivity-to-intervention testing. For each historical season in the 12-year back-test, the helm simulates what would have happened under different operational interventions — earlier crew mobilization, denser pollination passes, different pollen-mix ratios. This counterfactual analysis reveals which interventions historically delivered the most yield for the effort, conditioning on the season archetype. Growers planning the next season's strategy can see, for example, that under windy-narrow-receptivity archetypes, a 15% denser pollination pass historically returned 4.7% better fruit set on Medjool but only 1.2% on Deglet Noor — actionable knowledge a single-season record cannot produce. This strategic planning depth is what separates a back-tested forecasting engine from a real-time dashboard without memory.
The eighth tactic is parcel-cluster outlier identification. Across 12 seasons of data, most parcels within an oasis perform in a tightly correlated band — what affects parcel 3 typically also affects parcel 8. The back-test identifies outlier parcels whose fruit-set variance diverges from the oasis cluster, and the divergence typically points to a specific cause: aberrant microclimate, a pollination-logistics gap, cultivar-parcel mismatch, or irrigation drift. Growers then have a concrete, data-justified list of which parcels warrant individual attention versus which are performing to expectation. Without 12-season depth, outlier identification is just guesswork about which parcel "feels off" — with it, the claim becomes quantitatively defensible.
The ninth tactic is back-test validation of new interventions before deployment. When a grower considers adopting a new pollination technique — say liquid-suspension spraying instead of manual dusting — the back-test framework allows simulated application against each of the 12 historical seasons. The simulation isn't perfect (it depends on how well the intervention's effect can be parameterized), but it provides a quantitative first-pass assessment across many types of prior conditions rather than betting an entire season on a single-year trial. A new technique that simulates strong across 9 of 12 historical seasons is a low-risk adoption candidate; one that simulates strong in only 4 of 12 is a higher-risk bet worth piloting at smaller scale first.
Twelve Seasons of Signal, Not Twelve Years of Folk Wisdom
Oasis cultivators have always had 12 seasons of memory — what they lacked was 12 seasons of hourly data and a forecasting engine calibrated against it. HarvestHelm brings both. We back-test our pollination window countdown timer, our sandstorm spathe protection alerts, and our diurnal swing compensation against 12 consecutive seasons of data before calibrating a forecast for your specific Medjool, Deglet Noor, Barhi, or Zahidi blocks. Because our kilo-cut pricing only earns on the successful harvest, we are economically motivated to get the back-test right — a miscalibrated forecast costs us direct revenue. If you'd like to see what a 12-season back-test against your oasis's actual phenological record tells you about your 2026 bloom, we'll assemble the historical data, run the full retrospective, and deliver the findings as the foundation of a kilo-cut deployment.
Join the 12-season back-test waitlist before your first Medjool spathe emergence this February, and on day one the dashboard will show your bloom-timing archetype classification with cultivar-specific drift coefficients already fitted against your historical receptivity-day data. Waitlisted UAE and Tunisian research-cooperative operators who onboarded ahead of last Barhi bloom saw the emergence drift analysis expose a 6-day Medjool shift that had been silently pushing their crew mobilization two weeks late relative to actual receptivity. The back-test runs from ERA5 reanalysis and any partial on-site logs you have accumulated, so waitlist signup carries zero kilo-cut exposure until the first export tamar ships. Operations facing capital decisions on pollen-bank sizing or offshoot-propagation plans gain the most because the back-tested distribution at the 80th or 90th percentile delivers defensible numbers rather than best-year intuition.