Cold Pocket Pattern Analysis Across 10 Consecutive Apple Seasons
The Pattern Nobody Sees Without Ten Seasons of Data
A Western North Carolina orchard manager assumed the frost-prone spots on the ridge were the low terraces — classic cold-air drainage logic. Ten seasons of block-level sensor data told a different story. Two of the top four cold pockets were mid-slope terraces where a pasture gate downhill blocked drainage and ponded air behind it. One was a south-facing bowl that radiated heat fast on clear nights and flipped from "safe zone" to "coldest zone" under strong inversions. One was a terrace that changed cold behavior completely after a neighbor built an equipment shed in 2019. Three of these patterns would have been invisible with only two or three seasons of data. The decade horizon is what lets them emerge clearly.
This pattern recognition is impossible with one or two seasons of data. MSU Extension's analysis of farm air drainage explicitly warns that drainage patterns drift over years from plant growth, new construction, and canopy changes — multi-season monitoring is the only way to expose the shift. A grower running pattern analysis on only 2023 and 2024 data would have missed the 2019 shed event entirely, and would have kept treating the post-2019 cold pocket as an anomaly rather than a new permanent feature.
The USDA ARS guide to frost management documents exactly this mechanism: cold air drains to the lowest points, and obstructions can pond cold air 4-5 times their height. A 12-foot equipment shed creates a 48-60 foot deep cold reservoir upslope — large enough to shift frost risk for an entire terrace. Without a ten-season baseline, the grower cannot tell whether 2024's cold signature is weather variability or structural change.
The practical impact of missing the pattern is quantifiable. A block running wind-machine protection calibrated to pre-2019 cold signatures will fire at the wrong threshold once the equipment shed has reshaped the drainage — either firing late (protecting too little) or firing on nights that no longer need protection (burning fuel unnecessarily). Over five post-shift seasons, a mis-calibrated wind-machine deployment on a 10-acre block can waste $8,000-$15,000 in fuel while still losing fruit on the nights it was built to save. The ten-season pattern analysis is what detects and corrects this drift before it compounds.
Reading Ten Seasons on the Helm-Charted Yield Forecast
Think of cold pocket pattern analysis the way a yacht captain thinks about a pilotage chart annotated across ten years of passages: each voyage adds annotations about where shoals shifted, where new wrecks appeared, where the bottom scoured. A helm-charted yield forecast does the same for an orchard's cold-pocket topology. Every season's sub-critical events get logged, mapped, and overlaid against the previous nine — and the pattern that emerges is the ridge's actual frost signature, not the theoretical one implied by the topographic map.
HarvestHelm's ten-season analysis workflow aggregates every sub-28F event by location, duration, inversion strength, and synoptic weather pattern. The ScienceDirect study on fine-scale minimum temperature mapping in complex terrain grounds the approach: combining cold-flow accumulation with inversion strength maps recurring frost signatures across seasons. The helm surfaces three outputs that block-level growers actually use.
Data quality matters as much as quantity. A decade of readings from a sensor that drifted 2F over three years is worse than five years of well-calibrated data. HarvestHelm runs continuous cross-calibration between adjacent sensors and against reference stations, flagging drift within 0.5F and scheduling re-calibration or replacement before the data gets polluted. Ten seasons of trustworthy data is the input; ten seasons of unverified data is a liability that produces confident-looking but wrong conclusions about pocket behavior.
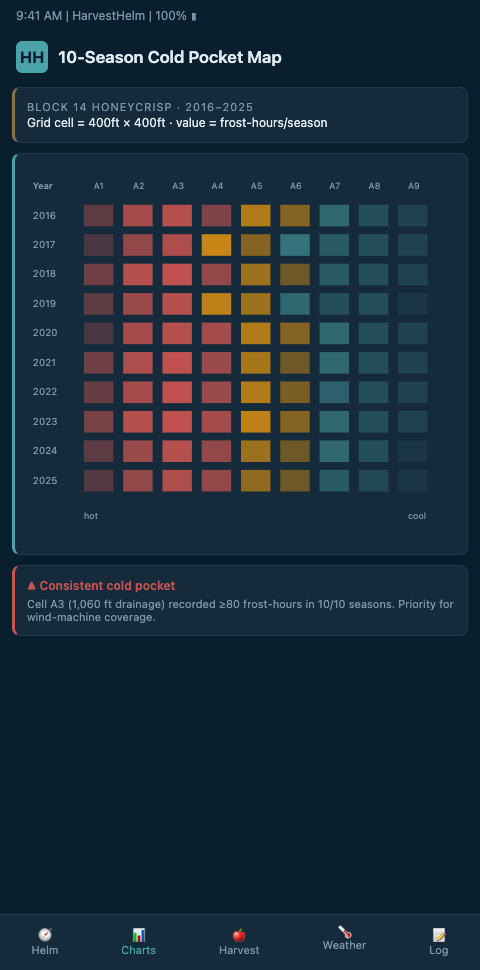
First, a recurrence heat map. Each grid cell in the orchard shows the number of sub-critical events per ten seasons. The top quartile of cells are the "reliable cold pockets" — the places wind machines should be physically pre-positioned because they earn their keep every year. The bottom quartile are the reliably safe zones where investment in frost infrastructure is waste. The middle two quartiles are where most growers over-deploy or under-deploy — the decision gets clearer only with decade-scale data.
Second, an inversion-strength stratification. The PMC study on Sierra Nevada cold-air pooling documents that cold-air pooling defies normal lapse rate logic — valleys can trap cold consistently under strong inversions and behave completely differently under weak ones. The helm separates events by inversion index (typically measured as the temperature differential between 2m and 10m sensors) and shows growers that Pocket A fires on weak inversions while Pocket C only fires on strong ones. This matters because different intervention strategies work for different inversion regimes — over-tree sprinklers for weak inversions, wind machines for strong.
Third, a structural-change detector. HarvestHelm runs a change-point algorithm across the decade looking for cold-pocket behavior that shifts abruptly rather than drifting. The 2019 equipment shed would show up as a step-function change in Pocket D's cold-event frequency — a signal the grower can then investigate and correlate to the physical cause. The MDPI Climate study on karst depression cold-air-pool frost risk validates the terrain-model approach; the change-point layer catches what the terrain model misses when the landscape itself changes.
The change-point algorithm is not just for new construction. Tree growth also reshapes cold-air drainage, and the shift happens gradually over 5-10 years as canopy height and density increase. A row of Honeycrisp planted in 2016 reaches full canopy closure around 2023-2024, and the resulting change in air-flow dynamics can redirect or pond cold air in ways the original block planting plan did not anticipate. Ten-season data captures this evolution, allowing the grower to adjust wind-machine placement or consider selective pruning to restore drainage pathways.
The Good Fruit Grower article on inversion conditions reinforces that inversion strength varies year-to-year — tracking reveals the repeatable frost-prone nights across seasons that only emerge at decade-scale. The PMC systematic review of spring frost risk strategies confirms site-specific historical data analysis as one of the most effective strategies in the toolkit, alongside active protection measures like wind machines and over-tree sprinklers.
Advanced Tactics for Decade-Scale Pattern Detection
Three moves separate shallow pattern analysis from rigorous ten-season detection. First, normalize for year-to-year synoptic variability before declaring a pattern. A pocket that fired in 2019, 2022, and 2024 is not "three of ten" if the intervening years had zero sub-critical events anywhere — those years do not count as votes. Score each pocket only against years where at least one sub-critical event occurred in the general region.
Second, combine cold-pocket pattern analysis with bloom-timing data. A cold pocket that consistently fires on April 25 but in a year when bloom is delayed until May 3 is an avoided event, not a missed event. The helm needs to cross-reference frost events with phenology to measure actual fruit-damage exposure — the raw frost count overstates risk for early-firing pockets in late-bloom years.
Third, use the ten-season data to retire sensors, not just add them. A pocket that has zero sub-critical events in ten years may not justify continued instrumentation, freeing budget for higher-risk zones. The audit discipline that makes this work connects to the broader multi-year chill drift analysis — both are decade-scale pattern readings of the same underlying climate. Both feed directly into a frost-hour futures model that prices risk block-by-block. Tropical mango plantations run a parallel 15-season analysis on monsoon shifts; the 15-season monsoon shifts study shows how the same decade-scale pattern discipline applies to disease pressure rather than frost.
A fourth tactic is decision-tree automation. Once the ten-season pattern is established, the helm can automate specific intervention responses based on early-evening sensor readings combined with historical pocket behavior. If tonight's 9 PM readings match the precursor pattern of a high-probability Pocket C cold event, the helm pre-positions wind-machine crews and triggers pre-chill irrigation runs on the specific terrace that pocket affects. This converts ten-season pattern knowledge from historical interest into operational automation, reducing the cognitive load on the grower during the critical frost-decision window at midnight.
For growers starting from less than ten years of data, the analysis is still useful — but needs to be framed as "seasons of observation" rather than a completed decade. Three seasons of data can identify the top-two most frequent pockets with reasonable confidence. Five seasons begin to reveal inversion stratification. Seven seasons start to distinguish structural change from weather variability. The full ten-season depth unlocks change-point detection, but incremental value accrues every year the dataset grows.
Build Your Orchard's Ten-Season Cold Pattern Map
Block-level growers who have wondered why the same four terraces lose fruit every bad spring can stop wondering. HarvestHelm ingests ten seasons of cold-event data per block and delivers a recurrence map, inversion stratification, and structural-change detector on a single helm. Zero upfront — kilo-cut only after the packhouse clears. Start the multi-season dataset today so 2034 is the year you navigate instead of guess. Join the HarvestHelm waitlist for Mountain Apple Orchards to begin your decade and stop treating every frost event like a first-time surprise. Pilots signing before the current dormancy cycle start the multi-season dataset on calibrated sensors rather than retroactively assembling imperfect records, which is the difference between trustworthy ten-season data and a liability that produces confident-looking but wrong conclusions.
Day-one dashboard views show every sub-28F event by location, duration, inversion strength, and synoptic pattern, with a recurrence heat map that ranks the top quartile of reliable cold pockets where wind machines earn their keep versus the bottom quartile where frost infrastructure is waste. Onboarding includes the change-point algorithm that catches abrupt behavior shifts like a neighbor's 2019 equipment shed ponding 48-to-60 feet of cold air upslope on a previously-safe Honeycrisp terrace. The kilo-cut contract settles only on cleared Honeycrisp, Gala, and Enterprise tonnage from pattern-informed blocks, so a wind-machine calibration mis-tuned to pre-2019 cold signatures that wastes $8,000 to $15,000 in fuel while losing fruit costs us before it costs your operating margin. Decision-tree automation pre-positions wind-machine crews and triggers pre-chill irrigation when 9 PM sensor readings match the precursor pattern of a high-probability pocket, which converts decade-scale pattern knowledge from historical interest into midnight operational automation.