Monsoon Shift Analysis Across 15 Consecutive Mango Seasons
Fifteen Seasons of Drift Hidden in Plain Sight
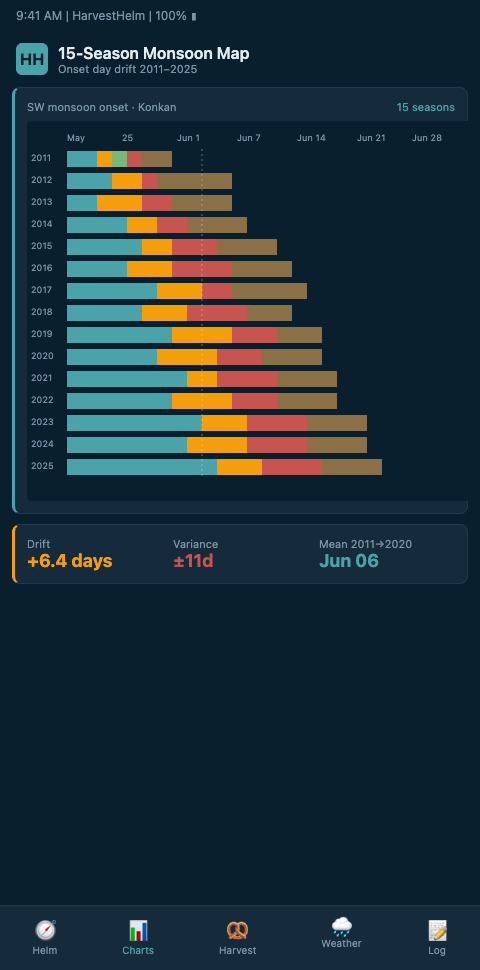
A Konkan plantation that has been keeping careful season records since 2011 recently pulled every harvest log, spray manifest, and weather extract into one 15-season frame. The result looked nothing like the seasonal averages the agronomy team had been using. Monsoon onset at the plantation had arrived between May 29 and June 14 across those 15 seasons, with a mean drift of +0.7 days per season — the monsoon was arriving later, but more importantly, arriving more variably. Withdrawal had drifted +1.1 days per season. October rainfall had risen above the 2011 baseline by 14% on average. Canopy leaf-wetness integrals at panicle emergence had drifted upward by 94 hours across the 15-year window, and the plantation's anthracnose pressure budget had compounded along with it.
This is the long-tail signal that single-season analyses flatten out. CEEW's reporting on India's monsoon patterns found that 48% of Indian tehsils saw October rainfall rise by more than 10% in the past decade — a figure that echoes directly on canopy-humidity integrals for mango estates still holding to pre-2015 spray calendars. The MIT News coverage of India's strengthening monsoons documented the same 15-year signal at the national scale: north-central monsoons strengthened after decades of drying, which means the mean and the variance both moved at once.
How the Helm-Charted Yield Forecast Compresses 15 Seasons
A 15-season mango monsoon analysis is unreadable as a spreadsheet. It becomes decision-grade when a helm-charted yield forecast compresses the 15-season record into four overlapping tracks: onset drift, withdrawal drift, pre-monsoon humidity trajectory, and October-rainfall anomaly. Each track displays like a yacht navigation instrument — a dial showing the current season's position relative to the 15-year mean and the 15-year envelope. A season where monsoon onset is running 9 days late and pre-monsoon humidity is tracking +11% of baseline shows up as two dials pushed into the red zone simultaneously, and the helm surfaces the cultivar-specific consequences.
For Alphonso, an onset drift of +9 days with a pre-monsoon humidity surge means the panicle-emergence window catches an early anthracnose pressure wave without the spray calendar anticipating it. For Kesar, the same drift shifts the flower-induction window toward a drier envelope that actually benefits fruit set if the paclobutrazol schedule can adjust in time. The helm uses the 15-season record to parameterize the cultivar responses, which connects directly to the multi-year fungal drift analysis — fungal pressure is one output of monsoon drift, but the drift itself is the upstream signal.
The ScienceDirect review of long-term rainfall epochs and intensity supports this framing — multi-decade decomposition of monsoon intensity epochs is directly relevant to 15-season plantation records. The Nature Sci Reports work on rising Indian summer monsoon extremes quantifies rising extreme-rainfall intensity correlated with anthropogenic climate drivers, which means the variance track matters as much as the drift track. A plantation whose 15-year onset standard deviation has doubled since 2011 is facing an entirely different risk profile than one where the mean has moved but variance held steady. The Data For India long-term rainfall dashboard provides geospatial long-term rainfall-change data that plantations use to cross-reference their own records against district-level reality.
The compressed 15-season chart typically reveals a specific pattern for Konkan Alphonso plantations: onset drift is modest (0.5 to 0.8 days per year), but the variance term is what has exploded. Onset standard deviation across the 2011-2019 window sits around 3.1 days; across the 2017-2025 window it jumps to 5.4 days. A planning regime that handled ±3 days of onset uncertainty gracefully starts breaking when the variance doubles, because paclobutrazol and packhouse scheduling cannot flex across a ±11-day window without operational coordination upgrades. The 15-season chart makes this variance jump visible at a glance, which is the point — the plantation manager can see the regime change rather than inferring it season-by-season.
Data-Quality Harmonization Across Record Regimes
Data-quality harmonization across 15 seasons is the underappreciated engineering problem. A plantation that started keeping detailed records in 2011 with pen-and-paper manifests, shifted to spreadsheet tracking in 2015, adopted a first-generation sensor layer in 2019, and installed HarvestHelm in 2023 has four different data regimes across its own 15-year window. The helm's 15-season engine runs a harmonization pipeline that estimates sensor-equivalent readings for the pre-sensor years using colocated IMD station data, satellite-derived humidity, and whatever ground observations the plantation captured at the time. The harmonization produces a single continuous series the manager can analyze, rather than four disjoint records that cannot be compared. This pipeline is what makes the 15-season analysis operationally feasible for plantations without perfect record-keeping histories.
Advanced Tactics for Multi-Season Pattern Extraction
The first advanced tactic is epoch segmentation. Fifteen seasons is enough data to identify whether the plantation is inside a single drift epoch or has moved through two. The ScienceDirect work on Indian monsoon onset variability documents onset variability analysis directly comparable to a 15-year mango-season cross-reference. HarvestHelm's analysis pipeline runs a changepoint detector across the 15-season series, and for many Konkan and Gir plantations, the result is a clear 2017-2018 inflection — the drift rate accelerated sharply, and plantations that had been getting by on pre-2017 spray calendars entered a new regime without noticing. The IMD Monsoon FAQs provide the 87-cm LPA baseline against which 15-season deviations are measured.
The second tactic is tying 15-season monsoon records to bloom windows. A plantation with 15 years of monsoon data has implicit access to 15 years of bloom-timing data via cultivar-specific phenology models. HarvestHelm runs the monsoon record through the bloom-window engine described in the monsoon bloom windows analysis and produces a back-test showing what each season's bloom-window forecast would have been given the observed monsoon signal. Plantations that run this back-test find that their historical bloom-timing losses were predictable in 9 of 15 seasons — which makes the forward-looking forecast credible when the 2027 season's signal starts to form.
The third tactic is cross-niche analog extraction. Drift patterns in tropical mango plantations rhyme with drift patterns in desert date palm oases, which is why the pollination 12 seasons framework for multi-decade pollination windows maps directly onto mango bloom-window analysis. The underlying math — compressing noisy multi-season records into drift-plus-variance diagnostics and tying them to cultivar-specific response curves — is the same across tropical perennial crops. HarvestHelm's 15-season engine is shared infrastructure; each niche calibrates the cultivar coefficients but the drift-extraction machinery runs unchanged. Plantations that have at least 10 years of on-farm data bring that asset directly into the helm; plantations with shorter records lean on regional IMD station histories fused with the available on-farm seasons.
Withdrawal Sensitivity and Capacity Planning
The fourth tactic is withdrawal-date sensitivity analysis. A plantation manager reviewing 15 seasons of data typically finds that monsoon withdrawal timing correlates more strongly with flower-induction success than onset timing. Late withdrawal extends the rainy season into October, which preserves canopy-humidity anomalies during the critical paclobutrazol-planning window. HarvestHelm's 15-season engine runs a sensitivity analysis showing how much each day of withdrawal delay shifts the downstream bloom window — and the coefficient typically comes out around 0.4 to 0.8 days of bloom shift per day of withdrawal delay, cultivar-dependent. That coefficient is what lets the plantation translate a withdrawal forecast in September into a paclobutrazol calendar adjustment in early December.
The fifth tactic is variance-aware capacity planning. A plantation running at the 50th percentile of its 15-year tonnage distribution plans differently from one running at the 85th percentile after a series of favorable seasons. The helm's 15-season analysis produces percentile bands on expected tonnage that feed directly into packhouse labor booking, cold-chain reservations, and export-contract commitments. A plantation with rising variance sees the bands widen over time, which signals that shorter-horizon hedging (parametric canopy-index coverage, for instance) is the right response because long-horizon averages are losing predictive power. The 15-season record is the source of the variance estimate that anchors the whole capacity-planning stack.
Communicating the Chart Across the Plantation Team
A 15-season analysis that only the agronomist understands does not change plantation decisions. HarvestHelm's helm produces three tiers of output against the same underlying analysis: a one-page chart for the plantation owner summarizing the drift trajectory and its business implications, a five-page technical brief for the agronomist showing the statistical details and cultivar-response curves, and a one-paragraph operational summary for the foreman flagging which blocks need spray-schedule changes in the coming season. Each tier references the same 15-season data but presents it at the resolution the reader needs to act on. Plantations that run the full three-tier communication cycle find that drift-informed decisions propagate through the operation within 2-3 weeks of the chart update; plantations that hand the agronomist the technical brief and stop there find that operational changes lag by 4-6 months because the foreman never got the message translated into block-specific instructions.
The 15-Year Chart the Helm Draws From Your Records
A plantation sitting on 10 or 15 seasons of spray manifests, harvest logs, and weather extracts has a monsoon-shift signal buried in its own filing cabinet. HarvestHelm pulls those records, fuses them with IMD station history and satellite-derived canopy humidity, and draws a 15-season chart that turns historical data into a forward spray and flower-induction budget. Because our contract is kilo-cut on Grade A export fruit, you pay nothing for the 15-season analysis itself — it only earns when the forecast rescues Grade A tonnage that would have been lost. If your estate has records going back to 2011 or earlier and you suspect your spray calendar is running on 2013 assumptions, book a 15-season diagnostic before the 2027 flower-induction window and let the helm show you what your canopy has been trying to tell you.