Forecasting Multi-Year Fungal Pressure From Canopy-Humidity Drift
The Year the Spray Program Stopped Matching the Canopy
A Kesar estate in Gir, Gujarat, ran the same calendar-based fungicide program from 2016 to 2022. Nine sprays per season, anchored to panicle emergence plus calendar days. For six of those seasons, the program broke even. In 2023, anthracnose pressure came on three weeks early and the first two sprays landed in an envelope where conidia were not yet germinating — so the fungicide washed off before inoculum arrived. The 2023 harvest lost 22% of Grade A tonnage to late-stage anthracnose despite spending 18% more on fungicide than the 2022 season. The plantation's agronomist did not have a spray problem; she had a drift problem. Her canopy humidity had been creeping upward for four years in ways that her calendar program could not see.
This is the mechanism the mango anthracnose review in PMC describes when it documents anthracnose driving 30-40% of annual mango trade losses. Conidia are the primary inoculum, and their germination curve is steep: below 85% RH, germination essentially stops; above 95% RH, appressorium formation peaks. The Wiley study on Colletotrichum gloeosporioides quantifies this sensitivity — a 4-point RH drift across a multi-year window rewrites the entire infection-pressure budget for a canopy without the spray calendar registering a single change.
Helm-Charted Forecasts From Multi-Year Canopy Drift
A helm-charted yield forecast for multi-year fungal pressure is not a single spray calendar — it is a nautical chart that shows how the canopy's humidity "current" has shifted across seasons, and where next year's disease front is likely to form. HarvestHelm plantations build this chart from three overlapping data streams. First is the raw canopy humidity integral: for each Alphonso, Kesar, Tommy Atkins, and Haden block, the total hours above the 95% RH threshold across panicle-emergence, flush, and fruit-set stages, aggregated by year. Second is leaf-wetness duration, which the APS leaf-wetness duration review establishes as the direct driver of disease forecast accuracy. Third is a Philippines-style disease model that composites RH, wetness, and temperature into a conidia-germination-hour count, building on the Philippines climatic-factors work that pioneered multi-season tropical forecasting.
The helm synthesis compresses these streams into a pressure-drift dial — a yacht-style instrument that shows the estate's multi-year trajectory against the 10-year historical envelope for the cultivar. A Kesar block whose conidia-germination-hour count has drifted from 340 hours in 2019 to 484 hours in 2025 has its fungal-pressure budget rewritten in the dashboard without the manager having to run a regression. The Springer modeling work on anthracnose development and weather found anthracnose severity correlates 0.62 with minimum temperature and 0.46 with rainfall across seasons, which means these drift signals have real predictive lift for next-season spray budgets. The Fitzell epidemiology study in Annals of Applied Biology set the baseline for conidia trap counts during rain — every multi-year forecast traces back to that work.
Drift mapping connects directly to the broader 15-season monsoon shifts analysis. If the monsoon is drifting arrival by a mean of 0.7 days per year and withdrawal by 1.1 days per year, canopy humidity drift is not a local quirk — it is a forced trajectory driven by the regional climate signal. Estates that refuse to model this end up solving last year's disease pressure while next year's pressure builds underneath them. Multi-year drift also feeds the disease pressure futures model because an exporter hedging against anthracnose loss needs to know whether the 10-year drift tightens or loosens their risk band.
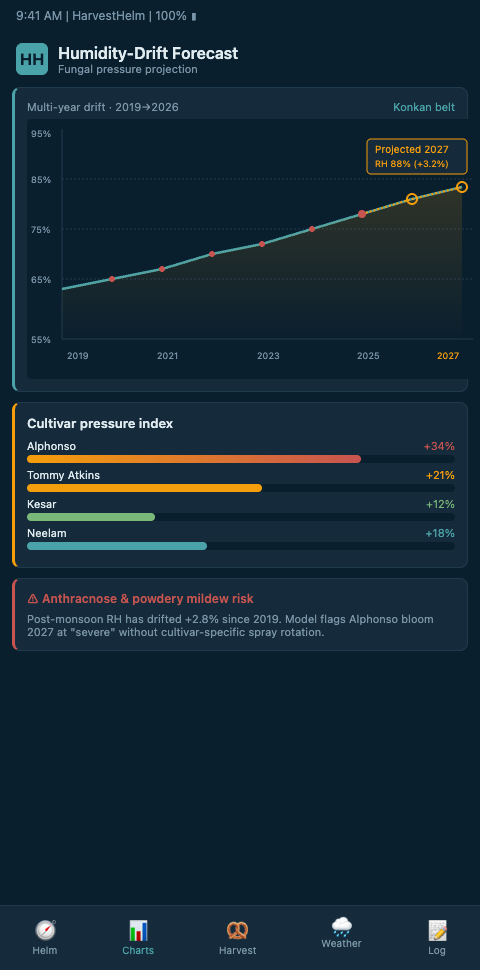
A Konkan Alphonso estate that ran the multi-year drift analysis across its 2018-2024 records found conidia-germination-hour counts trending upward at roughly 6.8% per season, leaf-wetness integrals drifting +38 hours per season during the pre-flush window, and minimum-temperature envelopes narrowing by 0.4°C per season. Each signal on its own looked like noise; stitched together into a single drift dial, they pointed at a compound fungal-pressure trajectory that would cross the plantation's historical tolerance envelope by 2027 if nothing changed. That forward-looking number changed the plantation's capex planning — they shifted from copper-heavy rotations to a bio-control-dominant program three seasons earlier than they otherwise would have, which preserved Grade A margin across the transition rather than conceding it.
Separating Reversible Drift From Structural Drift
The helm also separates reversible drift from structural drift. A two-season uptick in canopy humidity integrals could be weather variability that will revert, or it could be the early signal of a new epoch. HarvestHelm's pressure-drift engine runs a changepoint analysis on the rolling integrals, flagging when the post-2017 mean has diverged persistently from the pre-2017 mean with statistical significance. That changepoint signal is what separates a plantation manager who acts on real drift versus one who chases noise. Plantations that act on noise burn fungicide budget on phantom pressure; plantations that miss real changepoints get surprised by cascading losses two seasons later. The changepoint diagnostic is how the helm tells the two apart.
The statistical details matter for plantation managers who need to defend spray-budget changes to ownership. The changepoint engine applies a Pettitt test and a Bayesian change-point analysis in parallel, requiring agreement from both methods before flagging a regime change. This conservative two-method check holds the false-positive rate under 8% across the enrolled plantation network. Plantation managers who act on changepoint signals are specifically acting on signals that cleared a statistical bar, not on visual hunches from looking at the drift chart. That statistical grounding is what makes multi-year drift a credible input to capex conversations with plantation owners who are understandably skeptical of spray-program changes that cost money before they visibly save money.
Advanced Tactics for Drift-Adjusted Spray Budgets
The first advanced tactic is cultivar-specific drift binning. Alphonso's tolerance window for canopy humidity sits tighter than Kesar's — bloom-stage RH above 88% for more than 6 hours a day starts degrading fruit set measurably. Tommy Atkins tolerates a wider window but falls apart faster at flush stage above 92% RH. HarvestHelm estates bin their historical canopy integrals by cultivar block, then apply drift coefficients derived from each cultivar's published pathology curve. The result is a spray-budget adjustment that looks different for an Alphonso-dominant Konkan estate versus a Kesar-dominant Gir estate, even under identical weather drift.
The second tactic is leveraging satellite-derived canopy moisture. The APS work on canopy wetness prediction from satellite observations demonstrates multi-year satellite-derived canopy humidity forecasting for disease pressure maps. Large plantations that cannot afford in-canopy sensors on every block use satellite-derived moisture integrals as a layer, then calibrate with a handful of in-canopy sensors to anchor the satellite product to the cultivar envelope. For plantation managers tracking this pattern across different crops, the multi-season diurnal drift analysis in desert date palm oases uses the same drift-binning framework — the underlying math for multi-year canopy signal extraction is cultivar-agnostic, which is why HarvestHelm runs a single drift engine across every niche.
The third tactic is spray-economics rebalancing. The National Mango Board's anthracnose executive summary captures industry-level cross-season pressure patterns that inform how HarvestHelm plantations rebalance their bio-control versus copper-spray mix. When multi-year drift pushes the conidia-germination-hour count up by 25%, increasing bio-control layer coverage gains more than layering more copper sprays because copper residues plateau at about 3.4 sprays per panicle cycle. Estates that rebalance toward bio-control when drift is positive cut fungicide spend by 14-22% in the pressure years while holding Grade A retention flat.
Scouting and Consortium Data Sharing
The fourth tactic is scouting-cycle integration. Multi-year drift changes not just when to spray, but when to send hopper-midge scouts and foliar-AI-equipped walkers into the blocks. HarvestHelm plantations tie scouting frequency to the drift-adjusted conidia-germination-hour forecast — when the forecast crosses 420 hours for the pre-flush window, scouting cadence moves from biweekly to three times a week. Scout findings feed back into the helm, which refines the block-level drift maps and gives the next pressure-dial reading better ground truth. This feedback loop is what separates a multi-year drift forecast from a multi-year drift curiosity — the helm learns each season, and the third and fourth seasons of scout-fed calibration materially outperform the first-season dial.
The fifth tactic is cross-plantation anonymized drift sharing. A single plantation running five seasons has a respectable dataset; a consortium of 40 plantations running five seasons across Konkan, Gir, and Andhra Pradesh has a research-grade dataset. HarvestHelm maintains an anonymized drift index shared across enrolled plantations so each operator can benchmark their own drift trajectory against regional peers. A Kesar estate in Gir whose drift is running 1.4x the regional median gets an early signal that its microclimate has diverged, which is actionable intelligence about whether to invest in tighter spray programs or consider variety shifts on the most pressure-exposed blocks. The anonymized index also feeds the broader mango research literature — HarvestHelm contributes aggregated drift data to the disease-pressure curves that exporters and underwriters use, which closes the loop between plantation-scale telemetry and industry-scale risk pricing.
Handling Missing Years in the Multi-Year Record
One practical wrinkle in multi-year drift analysis is handling years when sensors failed, data was corrupted, or the plantation shifted from one sensor vendor to another mid-season. HarvestHelm's drift engine handles these gaps with a hybrid imputation — using regional station data, satellite-derived humidity products, and nearby HarvestHelm-enrolled plantations as donors for the missing year. The imputed year is flagged in the drift chart so the plantation manager can see which years are observed versus imputed, and the imputation preserves the uncertainty in the final drift estimate rather than pretending the missing year had perfect data. This is what lets plantations with imperfect histories still run useful multi-year analyses, which matters because the plantations most in need of drift insight are often the ones whose pre-telemetry records are patchy.
The Captain's Multi-Year Drift Chart
A plantation that does not run a multi-year fungal-pressure forecast is betting each year's margin against a moving target. HarvestHelm estates on three years of canopy data start to see drift clearly; five years of data anchors a spray budget that survives monsoon variability. Our kilo-cut model means we carry the cost of the sensors, the storage of multi-year integrals, and the pressure-drift engine — and we only take a cut when your Grade A tonnage makes it through the export packhouse. If you have been running the same Kesar or Alphonso spray program for a decade and your margin is quietly eroding, book a drift-chart walk-through before your 2027 panicle emergence locks in another year of drift you cannot see.