Why Elevation-Driven Yield Variance Breaks Traditional Apple Harvest Plans
When One Orchard Number Hides Four Different Crops
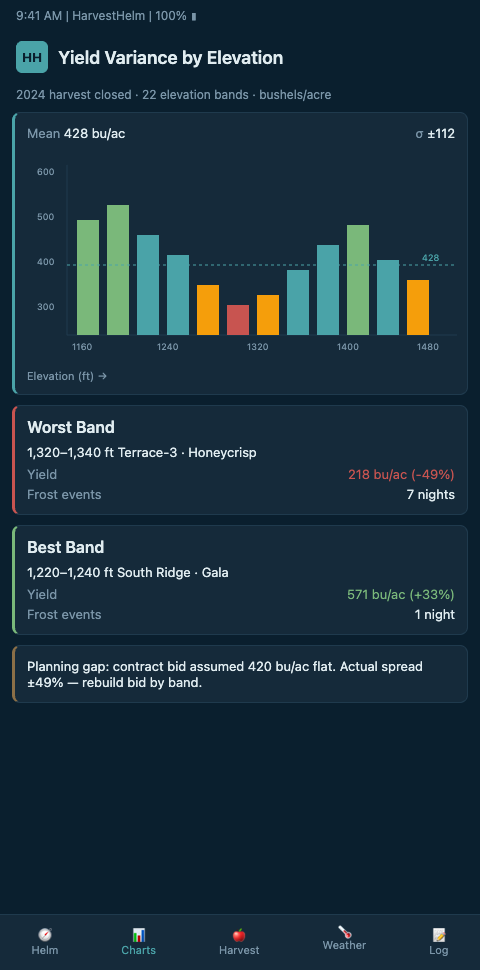
A grower calling the packhouse with one yield number for a 110-acre mountain orchard is committing four forecast errors at once — one per elevation band. Research published in the MDPI plant yield prediction framework shows yield is shaped by sunlight, temperature, and topography at a scale finer than the whole-orchard average can capture. Mountain apple growing pushes that principle to its breaking point. A 400-foot elevation gradient does not produce one crop with some noise — it produces four crops that happen to share an owner.
The packhouse pays for this error in two ways. First, booked bin space that does not show up costs carrying cost on empty cold rooms. Second, unbooked bin space that does show up pushes fruit into emergency storage at inflated rates, or forces premium fruit into CA-grade holding that commands a lower price. Either direction of forecast miss is expensive — and the single-number orchard-average forecast produces misses in both directions in the same season, because some blocks come in high while others come in low.
The APAL analysis of managing apple yield variability shows how within-orchard yield variability drags profitability unless growers match management to the variance, not the average. Most traditional harvest plans do the opposite. They take a single bud count, one packout estimate, one labor forecast, and apply those numbers to every block. The packhouse books bin space. The broker books volume. The contract crew books days. And then Block 14 Gala bloom hits three weeks before Block 22 Honeycrisp, Block 7 loses a third of fruit to a May frost, and the plan disintegrates across five bad weeks in August and September.
Penn State Extension's research on estimating apple yield and fruit size notes that early-season forecasts are what enable labor, storage, and marketing to line up. When those forecasts mask variance, everything downstream breaks. Earth.com's coverage of compounding climate threats adds that elevation-driven variance is getting worse, not better, as climate pressure pushes blooms earlier on warm slopes while cold slopes stay on a normal clock. The orchard-wide number keeps getting less useful.
The Helm-Charted Yield Forecast Versus the Clipboard Average
Picture a yacht captain briefed on a harbor with four discrete current bands — each one different speed, direction, and hazard. They would not hand the helmsman one wind number and expect them to steer. They would chart each band and helm-correct through the run. That is the shift a helm-charted yield forecast makes for mountain apple growers. Each block, each elevation band, each aspect gets its own yield projection — and the packhouse and broker see the composite, not an averaged lie.
HarvestHelm builds that chart from three layers. The first is bloom phenology by elevation. WSU extension's historical record on Red Delicious bloom dates documents up to a month of bloom difference between 700-foot and 3,400-foot orchards. That is not noise — that is four separate harvest planning conversations. The bloom timing elevation piece walks through how to forecast that stagger pre-season so your broker is not learning about it from a phone call in August.
The second layer is chill accumulation. Research from the PMC study on Himalayan apple altitude shift documents apple orchards shifting from 1200-1500m to 1500-2500m elevation bands as chill-hour drift forces relocation. Your Honeycrisp at 2,400 feet may be accumulating 200 more chill hours than your Gala at 1,900 feet — meaning their yield potential is no longer comparable even when they look identical from the access road. The chill hour calibration walkthrough covers how to calibrate the model to your profile, not a regional average.
The third layer is frost risk by parcel. The MDPI GIS study on vineyard and apple orchard suitability notes that elevation and exposure create crop-suitability variances, and — counterintuitively — lower basins are sometimes best due to reduced late-frost risk when the geometry favors air drainage. That is exactly the kind of finding that collapses the "higher is safer" rule of thumb most traditional plans encode. HarvestHelm's forecast engine reads your actual sensor history instead of applying a regional rule of thumb.
A fourth layer is packout grade variance. A block forecast that predicts tonnage but not packout grade is only half a forecast. High-elevation Honeycrisp often packs smaller, which means different box counts per bin even when the raw tonnage matches. The forecast engine should project by both tonnage and expected packout distribution so the broker contracts grade-specific volume, not just weight. This is where the chart gets operational — each block shows tonnage, grade split, and pack-out window, all updating as probe data evolves.
These three layers stack on a block-by-block dashboard. The view your broker sees shows not "18,000 bins expected" but "Block 14 Gala: 4,200 bins, September 8-14 window, 82% confidence. Block 22 Honeycrisp: 3,800 bins, September 24-October 2 window, 78% confidence." That is what a harbor chart looks like for apples.
Importantly, the dashboard is not a projection — it is a running forecast that updates as probe data changes. A cold mid-July week that delays Honeycrisp sugar accumulation should push the forecast window by three days and adjust the bin estimate by 5%. The broker sees the adjustment the same day; the packhouse can shift bin allocation before the labor calendar locks. This is what a captain's chart looks like for a harvest: current, not historical.
Advanced Forecasting Across Compounding Variables
Once you have block-level forecasts running, the next tier is variance-of-variance — capturing how your elevation effects interact with chill drift, aspect shifts, and cultivar-specific thinning windows. The most common failure mode is treating blocks as independent. They are not. A cold-air dam at the base of Block 14 pushes air back up into Block 9, which shifts bloom timing there by four days, which moves thinning decisions, which moves labor scheduling.
Draw those dependency lines explicitly. When HarvestHelm's dashboard shows a forecast drift on one block, tag the upstream and downstream blocks whose own forecasts should be reviewed. The second failure is trusting regional NOAA forecasts over local sensor data when they disagree. Davis Instruments research on mobilizing chill accumulation tracking shows location-specific monitoring routinely diverges from regional projections — your 2,600-foot north bench will behave differently than the nearest valley weather station by several hundred chill hours in a bad year.
This kind of block-by-block variance thinking is not unique to apples. Growers managing diurnal yield models in desert date palm systems face the same trap — one plantation-wide number hiding four actual crops on four different diurnal profiles. The math is the same: match forecasting granularity to the natural variance units of the terrain.
Third common failure: forecasting without a confidence interval. Every yield number should carry a range with explicit probability (for example, "3,800 bins ± 240 at 80% confidence"). When forecasts come without confidence intervals, brokers and packhouses plan against the point estimate as if it were certain — and the downside surprise lands on the grower. HarvestHelm's dashboard surfaces the confidence interval as a first-class number, not an afterthought, so the contract side sees the spread.
A fourth tactic: re-forecast after any weather event that moves probe data more than one standard deviation. Spring hail, a mid-summer heat wave, a sudden late-August rain — all shift the yield calculation. Running a weekly re-forecast through the high-variance months keeps the number honest. HarvestHelm automates the re-forecast trigger, so re-running the numbers is not a human task.
A fifth advanced move: tie the forecast to the kilo-cut pricing model so the grower and the forecast provider share the downside. HarvestHelm does this explicitly — our revenue only exists when the forecasted tonnage actually arrives at the packhouse scale, so we cannot afford to publish a forecast that inflates expectations. The alignment drives honesty in the forecast in a way that fixed-fee providers structurally cannot.
A final advanced pattern: aggregate the block-level forecasts into regional benchmarks only for context, never for contracting. Your orchard's block forecasts are the ground truth; a regional average is useful for seeing how your orchard's variance compares to others, but it should never be the number you book bins against. Too many growers still use the state crop estimate as their contracting anchor. The state estimate is an average of averages. Your four blocks each have better data.
The financial outcome of moving off the single-number forecast is measurable. Growers who move to block-by-block forecasting typically recover 3-8% of gross revenue in the first season — not through higher yield, but through tighter contracting, less emergency storage cost, and fewer labor recalls. Over a 5-year window, that recovery compounds into the cost of the sensor network several times over. HarvestHelm's kilo-cut model keeps the recovery in the grower's pocket until the bins actually clear.
Replace the Clipboard Average This Season
Mountain apple growers running elevation-band Honeycrisp and Gala blocks are getting squeezed hardest by the mismatch between one-number forecasts and four-crop reality. HarvestHelm is onboarding block-level growers, apple brokers, and packhouse operators ahead of the next harvest crunch window. We install sensors across your elevation profile, deliver block-by-block bin forecasts your broker can actually contract against, and take a kilo-cut only on cleared tonnage — so there is no upfront risk to replacing the clipboard average with an honest chart of what your slope will actually produce. Pilot slots include a walk of your four largest elevation bands with the forecast engineer, mapping each band's Gala, Honeycrisp, and Enterprise acreage to its own bin projection and contract window.
Day one of onboarding shows your broker a draft bin forecast grouped by elevation band and confidence interval, with the 80-percent downside case marked for packhouse bin-booking conversations that typically start around Labor Day. Growers joining before February capture a pre-bud-break calibration window for chill-hour drawdowns on south-facing Enterprise, which is the hardest cultivar to forecast accurately without two seasons of paired probe data. The onboarding contract explicitly ties the kilo-cut trigger to packhouse scale receipts by block, so if Block 7 loses a May-frost bloom while Block 22 Honeycrisp pulls through clean, you pay only on the Honeycrisp tonnage that actually cleared.