How to Forecast Bloom Timing Across a 400-Foot Elevation Gradient
When One Orchard Blooms Over 30 Days
WSU extension's historical bloom data for Red Delicious documents up to 30 days of bloom difference between orchards at 700 feet and orchards at 3,400 feet. A mountain apple orchard with 400 feet of elevation range — common across Appalachian and Cascade slopes — is running a compressed version of that same stagger inside a single property. Block 14 Gala at the valley floor is pink-bud while Block 22 Honeycrisp on the ridge is still dormant. That is four weeks of bloom scheduling compressed into one orchard's calendar, and it breaks every plan that assumes bloom is a whole-orchard event.
The consequence shows up as a cascade. Thinning crews show up for Block 14 before Block 22 is ready, so labor has to move and come back. Pollination services get over-allocated to early blooming blocks and under-delivered to the ridge. Frost protection runs on one schedule instead of staggered event windows tied to each block's actual bud stage. Research from ScienceDirect's global evaluation of apple flowering phenology models shows why single-orchard phenology forecasts fail under climate pressure — phenology shifts at different rates across elevations, and the models have to accommodate that.
The good news: GDD models work. Tree Fruit Research's Hoogenboom report developed a GDD-based model using 43°F base temperature for eight successive apple stages. The model is reliable when fed accurate probe data. It fails when fed a single regional weather station that averages across your elevation range.
Charting the Vertical Bloom Wave
A yacht captain navigating a harbor with four separate tidal current bands does not pretend there is one tide. They chart each band and plan the passage accordingly. Forecasting bloom across a 400-foot elevation gradient follows the same logic. Your vertical bloom wave is four separate phenology events stacked on top of each other. A helm-charted yield forecast lays each event out on the dashboard, with confidence intervals tied to the canopy-height probe feeding that block. HarvestHelm builds that chart block by block instead of averaging.
The forecast starts with block-level GDD accumulation. Research on PhenoFlex apple bloom forecasting shows PhenoFlex outperformed competing models with a 3.8-day RMSE on projected bloom dates when fed accurate temperature input. That accuracy only holds when the temperature input matches the block's actual thermal environment. Place one canopy-height temperature probe in the fruiting zone of each elevation band and feed the stream into the GDD accumulator.
Probe placement matters more than model selection. A high-quality PhenoFlex model fed data from a probe at an ambient weather station 400 feet below the block underperforms a simple GDD model fed data from a canopy-height probe inside the block. The lesson is counterintuitive but consistent in the research: accurate inputs beat sophisticated algorithms on heterogeneous terrain.
Use MSU's guidance on GDD accumulation for apple stages as the baseline model framework, but calibrate to local bloom records. Most orchards have at least three years of bloom-date memory even if it was never written down — "Block 14 Gala opened April 28 last year" is a calibration anchor. Feed those memory points into the GDD target and adjust the base temperature if needed.
Layer chill accumulation. Advances reviewed in MDPI's GDD models from flowering to harvest note that chill-to-heat model integration is what drives accuracy across variable elevations. A block that accumulates chill slowly in a warm winter may need more GDD to reach bloom, because partial chill satisfaction creates phenology lag. Your forecast has to combine chill and heat, not track them separately. The chill model calibration walkthrough covers how to calibrate that integration for your specific elevation profile.
The chill-heat integration is where most single-model forecasts break on mountain terrain. A GDD model that ignores incomplete chill produces bloom forecasts that appear two weeks earlier than reality — because the tree cannot actually respond to GDD accumulation until its chill requirement is satisfied. On a warm year with weak chill, this lag can reach 10 days on Honeycrisp specifically. Your probe network and your model together need to carry both signals into the bloom projection.
Validate with a regional tool for first-season calibration. Cornell's Climate Smart Farming apple freeze probability tool delivers 2.5-mile grid data for location-specific bloom forecasts, which is useful as a sanity check when your probe-driven forecast produces a new bloom date estimate. If your forecast and the CSF tool agree, trust it. If they diverge by more than a week, investigate whether your probe placement is catching the block's actual thermal environment. For Honeycrisp growers, the Honeycrisp chill hours aspect-signal post walks through how slope aspect shifts chill accumulation — a major driver of bloom variance.
A practical workflow: run the forecast at three decision points each dormant season. Forecast one at late January when enough chill is accumulated to make early bloom projections meaningful. Forecast two at late February when GDD accumulation starts driving bud-break timing. Forecast three at pink-bud, when the probe data can be compared against actual bud-stage observations to validate the model. Each forecast is more precise than the last, and the workflow prevents growers from anchoring on an early projection that later data would have corrected.
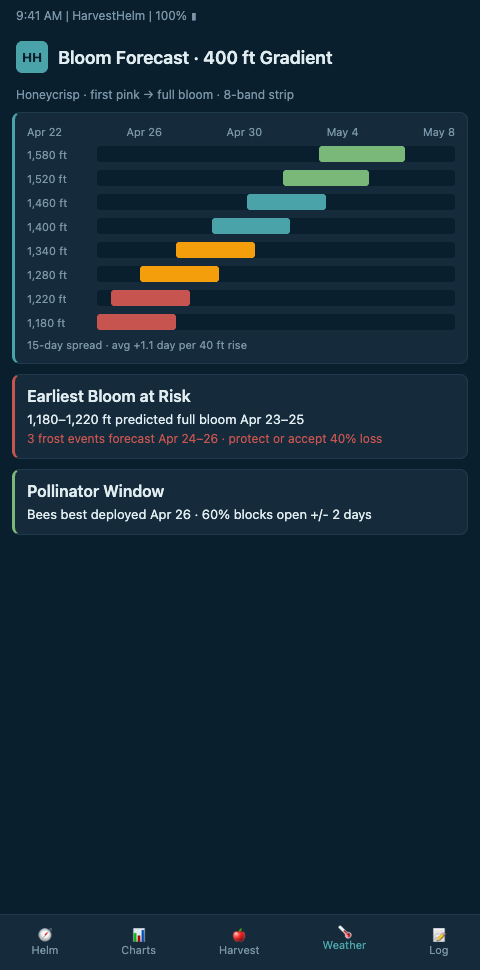
The helm-charted yield forecast display shows the bloom wave as a stacked timeline: each elevation band's projected pink-bud and full-bloom dates plotted side-by-side, with confidence bands shaded around each. The view looks like a harbor chart showing current bands at different depths — each block gets its own timeline, and the overall orchard bloom pattern emerges from the stack. HarvestHelm's dashboard generates this view automatically once probes are installed.
Advanced Tactics: From Forecast to Block-by-Block Labor Plan
Once your vertical bloom wave is forecast at 3-to-5-week horizon, turn it into labor scheduling. The forecast should drive three calendars: pollinator placement, frost-protection readiness, and thinning-crew deployment. Each calendar aligns to the block's expected bloom window, not the orchard's average. Research summarized in WSU's historical dataset shows the 30-day spread between elevations — so your labor plan may need three or four distinct crew waves through the orchard instead of one.
The most common forecast mistake is using one probe per orchard and interpolating. Interpolation collapses the variance you are trying to capture. Run at minimum one probe per 150 feet of elevation change. The second mistake is ignoring early-bud-swell probe data because "nothing's happening yet." Early bud-swell data is what calibrates the GDD target. Collect it at minute resolution starting in February, not March.
Third advanced tactic: tie bloom forecast to cultivar-specific pollen viability windows. Gala bloom overlapping Honeycrisp bloom on a mixed-cultivar ridge is only useful if the pollen windows actually align. When your forecast predicts Block 22 Honeycrisp bloom six days after Block 14 Gala peak, pollen from Gala will be nearly spent. You either plan pollinator timing around the stagger, or you plant with earlier-pollen varieties to bridge the gap.
This vertical-bloom-wave forecasting logic transfers to other climate-sensitive bloom systems. Growers tracking monsoon mango flowering face the same challenge in a different climate — regional models miss the block-level stagger, and probe-driven forecasting is the fix.
A fourth advanced tactic: publish the bloom-wave forecast to your broker and packhouse before bud-break instead of waiting for pink-bud confirmation. The earlier the forecast lands downstream, the more flexibility exists in labor and bin allocation. A broker who knows Block 22 Honeycrisp will bloom 10 days later than average in early March can lock in downstream buyer commitments in April instead of scrambling in September. The forecast's downstream value compounds with lead time.
A fifth tactic: tie the bloom forecast to your frost-protection readiness calendar. A block predicted to hit pink-bud on April 20 should have wind machines fueled, sprinkler lines flushed, and protection crews on-call by April 15 — not May 1. Block-by-block bloom forecasting drives block-by-block protection readiness, which is more efficient than running the whole orchard on one calendar. The efficiency shows up directly in diesel costs and crew callout pay.
A sixth tactic: use the bloom forecast to plan pollinator hive placement. Bees work a radius around the hive, and on a compressed bloom wave with four elevation bands blooming over three weeks, hive placement should track the bloom front. Place hives on the ridge first when the low blocks are blooming (to pre-condition bees for when the ridge opens), then relocate midway through bloom as the sequence progresses. This kind of precision placement is only possible with a reliable vertical bloom wave forecast.
Forecast Your Vertical Bloom Wave This Spring
Mountain apple growers running elevation-banded Honeycrisp, Gala, and Fuji blocks can replace the panic-scheduling approach with block-by-block bloom forecasts this season. HarvestHelm installs canopy-height probes across your elevation gradient, runs the combined chill-and-heat model block by block, and delivers bloom-date forecasts with confidence intervals your labor and pollinator scheduling can actually plan against. Kilo-cut pricing means no cost until the bins from that forecasted bloom actually clear the packhouse scale. Apple brokers working multi-elevation orchards gain the same benefit: the vertical bloom wave forecast becomes an input into their harvest-window commitments downstream. Pilot onboarding starts in late January when chill accumulation is far enough along for a first-pass bloom projection to be useful for pollinator coordination with your beekeeper.
The day-one dashboard shows a stacked timeline of projected pink-bud and full-bloom dates for each elevation band, with the 3.8-day PhenoFlex RMSE drawn as a confidence band around each block and a separate column for chill-satisfaction status on Honeycrisp specifically. Growers joining before February get a shared bloom-wave forecast that your fruit broker and packhouse supervisor can subscribe to, giving them the vertical stagger in March instead of scrambling through it in September. The onboarding contract ties the kilo-cut trigger to the actual harvest window each block delivers into, so a Block 14 Gala bloom forecast that overshoots by four days costs us before it costs your thinning crew. Wind-machine readiness calendars generated from the bloom forecast shift block-by-block instead of running the whole orchard on one calendar, which cuts diesel and on-call crew pay across the frost-protection season.