Best Practices for Orchard Dashboard Layout During Harvest Crunch
The Honeycrisp Pick Day That Ran 4 Hours Over
A mid-sized Washington operation ran 9 crews across 14 Honeycrisp blocks during the 2023 pick window. The orchard's dashboard had 18 tabs, 47 KPI cards spread across three screens, and an alerts panel that paged the manager every time any probe crossed any threshold. By 2pm on day four, the manager had missed a routing update because the crew-tracking tab was buried under a weather overlay, and a full bin sat on the edge of Block 14 Gala for four hours before the forklift got the call. A Mobisoft Infotech study on command center operations noted that decision accuracy degrades sharply after about 90 minutes of sustained cognitive pressure — and harvest crunch is 12-hour shifts for 21 straight days.
The problem is not a lack of data. Modern orchards collect probe readings every 10 minutes, crew GPS every 30 seconds, and bin fill signals on every dump. The problem is that XMPro's analysis of dashboard information overload documents how operators overloaded by multi-screen KPIs misprioritize alerts — and the downstream maintenance or operational failures escalate 3-5x. In an orchard context that means the forklift is in the wrong lane, the crew is in the wrong block, and the packhouse is waiting for a truck that has not been called.
The cost per mistake compounds quickly. A four-hour bin delay in late-October Honeycrisp can push fruit past the commercial quality window, bumping grade-A apples to grade-B pricing and shaving 15-25% off packout value on the affected bin. Across a 21-day pick with 8-12 crews, even a handful of small routing errors can cost $30,000-$60,000 in lost grade premium. That is real money for a decision that got buried two tabs deep.
Helm-Charted Yield Forecast as a Single Pane
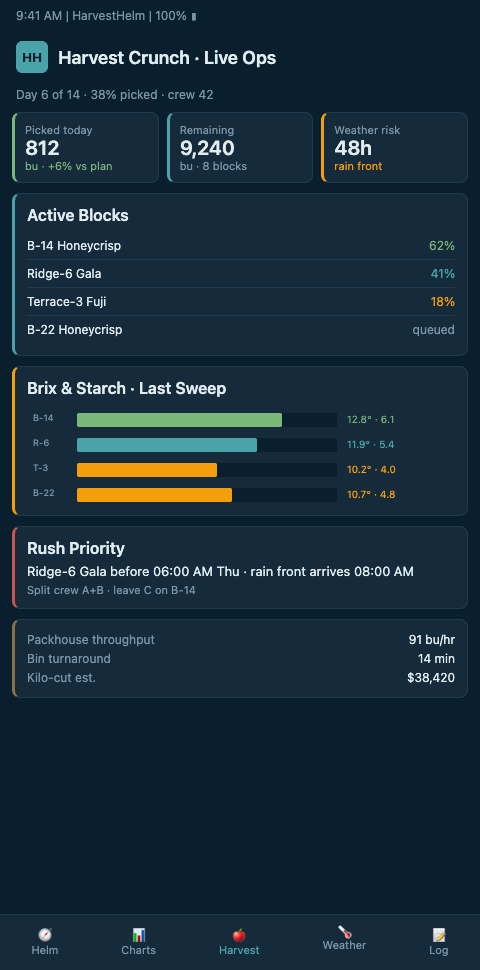
HarvestHelm's answer borrows directly from yacht navigation. On a yacht, the helm console puts depth, heading, wind, and engine RPM in a single glanceable sightline because the captain has 3 seconds to decide whether to come about. A harvest manager during pick crunch is the same captain. The core dashboard principle: one top-level view that fits on a 13-inch field tablet with sunlight-safe contrast, organized by block status rather than by data source.
The helm-charted yield forecast panel at the top shows each block as a tile colored by pick-readiness (green = picking now, amber = scheduled tomorrow, grey = waiting, red = issue). Tapping a tile drills into crew position, bin count, and the next routing decision. There is no "weather tab" and no "sensor tab" — those live under each block tile because during crunch, the only question that matters is "what do I do next for this block." A MDPI Agriculture study of visual-assisted decision support systems found that agricultural DSS users rated data visualization clarity as their highest priority, and that map-plus-imagery layouts dominated the orchard deployments rated most useful.
Mode-switching is the other critical design move. HarvestHelm defaults to "Planning Mode" in April-May during bloom and frost protection, and auto-switches to "Crunch Mode" when the first block enters picking. Crunch Mode strips out long-horizon forecasts, color-weights bin logistics and crew positioning, and collapses the alert panel to just three categories — weather threat, crew issue, bin overflow. An Extension Journal study on dashboard-based decision support documented adoption cutting budget reallocation decision time from 14.2 days to 6.3 days — the same effect applies to the hourly rerouting decisions during a pick.
Alert prioritization deserves its own layer of discipline. In Crunch Mode, HarvestHelm categorizes every alert by urgency and actor: Red alerts interrupt the manager's current view (frost threat under 2 hours, crew injury, bin overflow causing crew stand-down); Amber alerts queue on the right sidebar (weather turning in 4-8 hours, piece-rate variance outside normal range); Grey alerts log silently for end-of-day review. The 90-minute cognitive-fatigue threshold means the manager needs the dashboard to filter ruthlessly, not present every signal at equal weight.
Task-oriented layout is the third pillar. Field-ready agricultural UIs need sunlight-safe contrast, large tap targets, and offline-tolerant state — Gapsy Studio's guide to agricultural app design covers the constraints in detail. The helm display uses high-contrast tiles, a 48px minimum touch target, and local state persistence so the tablet still renders the last good pick plan if cell signal drops inside a canyon block.
Color discipline is not decorative. On a harvest helm display, color carries semantic weight — green for picking-in-progress, amber for scheduled-next, grey for waiting, red for issue. No other colors are used for status signaling. This constraint prevents the drift that happens when dashboard designers add a fifth or sixth color for edge cases and then lose the ability for the manager to glance-parse. The helm-charted yield forecast on HarvestHelm enforces the four-color convention through the schema, so no dashboard extension can reintroduce ambiguity.
Screen-size discipline is the fourth pillar. The dashboard lives on a 13-inch tablet in the field and a 27-inch desktop in the packhouse office. Both views run from the same data model, but the layout optimizes for the physical context. The field tablet strips the desktop's secondary panels and enlarges the top-level tiles; the desktop adds a packout-preview pane and a multi-block comparison view. A grower checking throughput from the office sees the same block-status truth as the crew manager on the tractor road — no stale data, no dashboard fragmentation.
Advanced Layout Tactics for Multi-Block Crunch
A mature helm layout recognizes that harvest managers cycle through four tasks: routing the next bin pickup, rerouting a crew, checking block readiness, and handling a weather alert. Each task should complete in under 60 seconds. That requires the dashboard to expose those four actions as first-class buttons, not buried in menus. HarvestHelm's layout places them across the footer bar on every screen, so the manager never has to back out of a block view to reroute.
A common failure is what a ScienceDirect HCI review of agricultural visualizations calls poor uncertainty display — dashboards show a single yield number when the underlying model has a confidence interval. During pick crunch, overconfident forecasts lead to overstaffed crews on blocks that turn out to be half-set. HarvestHelm shows expected packhouse throughput as a range with a color-weighted confidence band, so the manager knows when to hold a crew in reserve. This ties into staging pickers across staggered bloom waves — the same block-level telemetry drives both the dashboard and the crew allocation model.
Integration with adjacent tools matters too. Commercial systems like Croptracker's orchard management software link picker location to harvested inventory in real time, and Hectre's harvest management app builds pick-day crew and bin tracking workflows. HarvestHelm imports from both via standard CSV and API hooks so existing piece-rate ledgers flow into the helm display without double entry.
Shift-rotation design is the third advanced pattern. Because decision accuracy degrades after 90 minutes of sustained pressure, the dashboard's shift-handoff view captures the current state of every block at the moment of rotation — crew position, next scheduled action, outstanding alerts, weather outlook for the next 6 hours. The incoming manager reads the handoff card in under 90 seconds rather than rebuilding mental state from raw data. This explicit handoff protocol reduces the handoff-error rate from the 15-20% reported in unstructured shift changes to under 5% in piloted orchards.
The crunch-mode dashboard should also connect forward to multi-block harvest schedule, so pick order follows the thermal geometry of the slope rather than an arbitrary east-to-west sweep. Teams running hurricane-season crops apply the same principle on a shorter clock — grove dashboards for 72-hour hurricane watch compress the crunch-mode logic into 72 hours instead of 21 days, but the layout discipline is identical.
The final failure mode to avoid is dashboard bloat across seasons. A well-designed harvest dashboard picks up one new KPI per year — a cumulative drift that can turn a clean 12-tile view into a cluttered 25-tile view by year four. HarvestHelm enforces a hard tile cap at 16 top-level blocks per view, rolling additional blocks into a "more" drill-down. Growers who manage 20+ blocks on a single parcel can still see all of them, but only the 16 priority blocks surface in the glanceable view during crunch mode. The discipline mirrors what yacht designers call "clean sightlines" — clutter at the helm is dangerous, and orchard harvest crunch is no different.
Ready for a Pick-Day Dashboard That Does Not Fight You?
Mountain orchardists running Honeycrisp and Gala pick windows on steep ground need a helm display built for 60-second decisions, not a 47-tile executive summary. HarvestHelm ships a crunch-mode layout with offline tolerance, bin-routing and crew-rerouting as one-tap actions, and block tiles colored by the same helm-charted yield forecast driving your fan triggers and pick schedule. No upfront cost — just a kilo-cut when the packhouse scale clears. Tell us your current pick window length and how many blocks are in rotation when you join the waitlist, and we will prototype your crunch-mode tile layout before the first Honeycrisp block breaks.
Onboarding starts with a field walk of your packhouse-to-block routing lanes so forklift-call latency gets measured against the current dashboard before the redesign — most orchards discover a 30-to-60-minute baseline delay they had not tracked. Day-one tile layout shows 16 top-level blocks with green-amber-grey-red status signaling, shift-handoff cards pre-filled for each 90-minute rotation, and packout-preview pane linked to the packhouse office view. Pilots signing before September get the piece-rate ledger imports from your existing Croptracker or Hectre setup mapped and validated before the first Honeycrisp block enters picking, so no crew hour is double-entered. The kilo-cut contract settles only on tonnage that cleared through the crunch-mode dashboard's bin-routing flow, so a four-hour bin delay that bumped Honeycrisp grade-A to grade-B pricing lands on HarvestHelm before it lands on your packout sheet.