How to Audit Spray Timing Against Actual Bloom Infection Curves
Why Most Spray Programs Fail the Post-Season Audit
Mango fungicide programs are typically designed before the season starts, based on historical spray calendars and general disease-pressure assumptions for the region. The season then plays out with actual weather, actual infection pressure, actual bloom phenology — and the pre-season program almost never matches the actual conditions with precision. But most plantations never reconcile the two after the season ends. The spray log goes into the filing cabinet, the packhouse rejection numbers get rolled up into annual totals, and the next year's program repeats the same pre-season assumptions.
The Nature Communications Earth & Environment meta-analysis of 80 decision-support-system experiments found that DSS-triggered fungicide programs cut treatments by 50 percent or more compared to calendar-based programs, with equivalent disease control. The implication is that roughly half of calendar-scheduled sprays land outside the actual infection windows — they are either too early (when pressure has not yet materialized) or too late (when the infection event has already passed). Without a post-season audit, a plantation has no way to identify which passes were effective and which were waste.
The Philippines model documented in Wiley Dodd 1991 research on pre and post-harvest control of mango anthracnose famously showed that one precisely-timed fungicide application achieved equal disease control to six calendar-based sprays. That 6-to-1 efficiency ratio is not theoretical — it is observable in plantations that run audit protocols. The Scialert review of mango anthracnose research priorities documents the MAE (microprocessor-based) forecasting models developed in Australia and the Philippines that time sprays against actual infection periods rather than calendar dates. The audit framework is the mechanism that turns this research into plantation-level operational improvement.
The specific audit gap that costs the most is the infection-window-missed event. An untreated infection window during peak bloom drops a measurable inoculum load into the canopy, and research from Springer Australasian Plant Pathology on modeling anthracnose development captures the infection dynamics mathematically — maximum disease occurs at minimum temperature of 27°C, RH at or above 90 percent, and rainfall around 56mm, with logistic models fitting the observed disease curves at MSE 37-100. A plantation that missed even one such window during bloom ends up carrying elevated inoculum through fruit development, with latent infection manifesting post-harvest during transit. Audit reveals these misses; calendar-based thinking never does.
Running the Audit on a Helm-Charted Yield Forecast
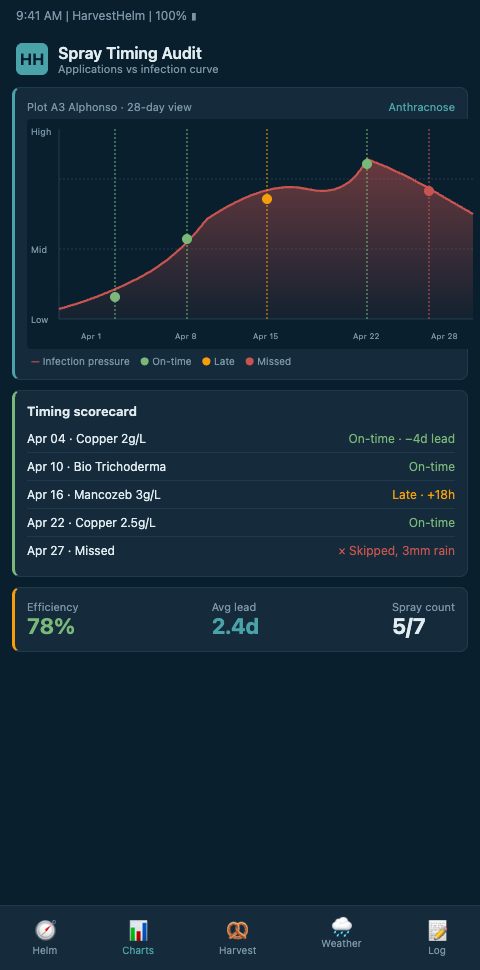
HarvestHelm approaches spray timing audit the way a yacht captain runs a post-passage review of the log against the weather charts — every decision gets evaluated against the actual conditions that unfolded, and the review drives specific improvements for the next passage. The helm-charted yield forecast aggregates the full season's canopy sensor data, spray interventions, and packhouse outcomes into a single audit view. The dashboard renders a reconciled infection curve for each block, overlays the spray events, and highlights both wasted passes and missed windows. A captain does not audit the log by skimming the weather report — the captain lays the hourly log next to the hourly weather chart and compares them line by line.
The audit architecture runs four layers. Layer one is the reconstructed infection curve. For each block, HarvestHelm takes the season's continuous canopy RH, temperature, leaf wetness, and precipitation data and runs it through the anthracnose infection model documented in the Springer Australasian research and the APS Plant Disease pepper anthracnose timing research. The output is a continuous infection-pressure curve across the bloom window, with specific windows where the model predicted active infection. This curve is the ground truth for audit — every spray gets evaluated against where the infection pressure actually sat.
Layer two is the spray-event overlay. HarvestHelm plots each spray intervention (copper, bio-control, systemic) on the same timeline as the infection curve, with colour-coded chemistry and volume indicators. The visual overlay makes it immediately obvious which passes landed on active infection windows, which landed on low-pressure periods, and where the infection curve showed spikes without any intervention. Research from ScienceDirect on soybean fungicide calendar versus agrometeorological data demonstrates the efficiency gap between calendar schedules and weather-driven spray decisions — the spray-event overlay visualizes that gap for each block-season combination.
Layer three is the outcome reconciliation. For each block, HarvestHelm pulls the packhouse rejection data (anthracnose percentage, powdery mildew percentage, other fungal indicators) and reconciles it against the infection curve and spray events. A block with high rejection rates despite heavy spray coverage indicates misaligned timing — sprays hit but missed the actual infection windows. A block with low rejection rates despite lighter spray coverage indicates well-aligned timing — few passes, each landing on a real infection window. The reconciliation pattern across the plantation reveals systemic timing issues versus block-specific anomalies. This integrates with spray rig trigger logic because next-season spray trigger refinement depends on current-season audit findings.
Layer four is next-season recommendations. The audit produces specific recommendations for the following season: adjust threshold parameters for the sensor triggers, shift chemistry routing rules for specific blocks, change pre-bloom protocol timing for late-flush blocks, increase sensor density in blocks with high within-block infection variance. These recommendations get logged into the dashboard's next-season configuration, so the audit findings directly shape the upcoming season's operations rather than getting lost in a report that no one reads. The UF/IFAS anthracnose and powdery mildew management blog notes that preventive fungicide timing must align with high humidity and rainfall windows — the audit validates whether last season actually achieved that alignment and whether next season's program needs adjustment. This integrates with copper spray versus bio-control chemistry selection for the upcoming season.
Advanced Tactics for Multi-Season Audit Rigour
The advanced layer of audit tactics separates plantations that improve spray efficiency by 10 percent per year from those that plateau after one good audit. The first tactic is multi-season trend detection. A single season's audit reveals that-year's timing errors; a three-season audit reveals systemic patterns — blocks that consistently experience infection pressure two weeks earlier than the plantation average, or cultivars that show residual anthracnose at rates indicating chronic under-treatment. HarvestHelm's dashboard stores audit data across seasons and surfaces trends that would be invisible in a single-year view. Research from the Wiley Dodd 1991 climatic factors study documented classic empirical data on climate factors driving Colletotrichum infection periods — multi-season data confirms whether the plantation's own history matches those empirical patterns.
The second advanced tactic is peer-benchmark audit. Plantations with similar cultivar mix, climate zone, and management approach can benchmark their audit findings against peer plantations running on the same platform. If a Ratnagiri Alphonso plantation has 62 percent well-timed sprays while the regional median is 78 percent, that gap represents specific, addressable improvement opportunity. HarvestHelm aggregates anonymized regional audit data and provides plantation-level comparisons that pure internal audits cannot produce. Mountain apple growers facing a similar analytical need for late-freeze coverage audits use similar peer-benchmark logic for sensor placement decisions, and the cross-crop methodology transfers cleanly.
The third advanced tactic is audit-driven sensor densification. Block-level audit findings identify which blocks have high infection-pressure variance within their existing sensor coverage — those are the blocks where additional sensors would produce the biggest improvement in next-season trigger accuracy. A block where three sensors disagree on RH by 6 to 9 percentage points during peak bloom is a block that deserves additional sensor nodes before next season. The audit thus functions as a capital allocation tool for sensor infrastructure, directing investment to where it produces the largest marginal improvement in decision quality.
Translating Audit Findings Into Field Operational Changes
The audit itself produces data; the value comes from translating audit findings into specific, executed operational changes before the next season begins. Plantations that complete the audit but skip the translation step see no year-over-year improvement — the audit becomes a post-season report that sits on the shelf. HarvestHelm's dashboard forces the translation by requiring each audit finding to be linked to a specific configuration change (trigger threshold adjustment, chemistry routing rule update, sensor placement modification, or labour staging refinement) that gets applied before the next season's bloom begins.
The operational change log is kept alongside the audit findings so the plantation can trace cause and effect across seasons. If the dashboard shifted the Alphonso wetness threshold from 4 hours to 3.5 hours based on the previous season's audit, next season's audit can evaluate whether the 3.5-hour threshold produced better-aligned spray timing or whether the change introduced false positives. Each audit cycle thus refines the configuration rather than treating each season as a blank slate. Research from the Scialert mango anthracnose review documents how iterative model refinement drove the success of the Australian and Philippine MAE forecasting systems — the audit-to-configuration-change loop is how plantation-level operations get the same benefit.
The second translation mechanism is crew briefing updates. Audit findings often reveal that field crews were executing the spray plan correctly but the plan itself was mistimed — or conversely that the plan was correct but field execution drifted from the specified timing. Separating these two failure modes requires both environmental data and execution logs in the same view, which HarvestHelm produces as part of the audit. Briefing updates for the next season then specify either plan corrections or execution improvements, targeting the actual root cause rather than treating all timing errors as execution failures.
Audit Is How Your Plantation Gets Better Every Year
A plantation that does not audit its spray timing against actual infection curves repeats the same errors year after year. A plantation that runs rigorous audits turns each season's data into the next season's competitive advantage. HarvestHelm's kilo-cut monetization model means the platform earns more when audit-driven improvements produce cleaner export-grade fruit — aligning the dashboard's audit recommendations directly with the plantation's realized outcome.
The spray log is not just a compliance record; it is the input to the review that determines whether next season's fungicide program is a repeat of this season or a refined upgrade. Ratnagiri, Junagadh, and Krishnagiri plantations that have implemented post-season audit protocols report cumulative 35 to 48 percent reductions in fungicide cost over three seasons while holding or improving export-grade conversion. Book a post-season audit with HarvestHelm before your next pre-monsoon planning cycle — we install in-canopy wetness and phenology sensors across your Alphonso, Kesar, or Tommy Atkins blocks, load this season's spray log and export-grade conversion against the observed infection curves, and deliver a revised operating plan before the next flush cycle begins. Zero upfront; the kilo-cut only activates on cleaner export-grade tonnage. The infection curves unfolded whether you watched them or not. The audit is how you make sure next season's program actually aligns with them.