Building a Flush-to-Bloom Timeline From Hyperlocal Humidity Data
The Cool-Period Gate Your Regional Forecast Cannot Confirm
Mango flush-to-bloom transition is a physiological gate. Pass the cool-period threshold and floral initiation activates. Miss it and the trees stay vegetative. ScienceDirect research on leaf age, cool temperature duration, and photoperiod established the fail-mode clearly: young leaves under seven weeks or cool periods under three weeks fail to trigger floral initiation. If your canopy did not hold the right cool-period humidity-temperature profile, you will flush without blooming, and the district forecast likely told you conditions were "favorable" the whole time.
ISHS data on degree-days and base temperatures for mango inflorescence puts a number on it: the Manila cultivar requires 434.7 degree-days accumulated at a 12-degree-Celsius base for inflorescence elongation. Different cultivars have different thresholds, but the structural logic holds: bloom depends on cumulative thermal-humidity accumulation that only canopy sensors capture with fidelity. Regional stations smooth these accumulations across too much terrain.
The cost of getting this wrong is tangible. Blocks that miss the cool-period gate stay vegetative and consume the same labor and chemical inputs as blooming blocks but produce no fruit. Plantations that manage flush-to-bloom on assumption rather than measurement often discover their mistake when panicle counts at mid-season look 30% lower than expected. By then, the season is set.
The problem compounds when plantations rely on bloom-date tradition. "Alphonso blooms early February" might have been accurate for 20 years, but ResearchGate work on phenology across BBCH stages describes why the mesostages between flush and bloom are climate-sensitive: a two-week shift in cool-period onset cascades through bud swell, panicle elongation, and anthesis in ways that invalidate single-date assumptions. The tradition holds only as long as the climate holds. For most plantations, the climate has not held.
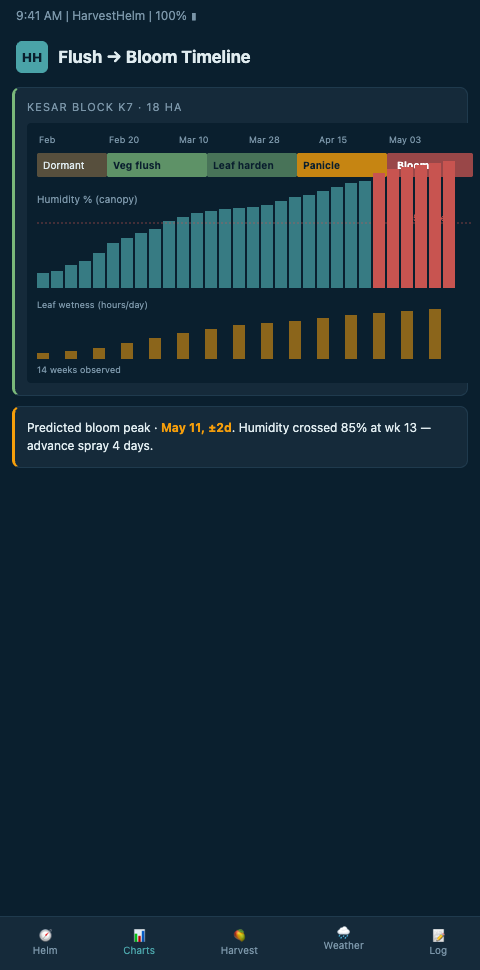
Helm-Charted Flush-to-Bloom: Hyperlocal Humidity Timeline
HarvestHelm builds a flush-to-bloom timeline per block using hyperlocal humidity and temperature sensors, displayed on the helm-charted yield forecast dashboard. Like a yacht's chart plotter, the timeline shows where each block is along the physiological voyage: vegetative flush, mature leaves, cool-period accumulation, floral initiation, panicle emergence, and anthesis.
The first layer is a continuous humidity log at 10-minute resolution across the plantation. Onset orchard monitoring systems illustrate the commercial category: HOBO-class loggers deployed in-canopy to capture the humidity swings that define flush-to-bloom progression. The helm ingests this stream and builds per-block 24-hour, 7-day, and 21-day humidity integrals, which are the time scales that matter for floral initiation physiology.
The second layer is a cool-period accumulator. Using the Mango.org flowering review compiled by Cavalcante, the helm references environmental drivers that push blocks across the flush-to-bloom gate. The accumulator increments cool-period hours when canopy sensors register conducive temperature and humidity combinations, and the gate flips to "initiation-ready" once the block reaches its cultivar-specific threshold.
The third layer is a phenology confidence band. Based on the ScienceDirect review on mango flowering physiology, the helm models hormonal and environmental drivers of the flush-to-bloom transition. Rather than committing to a single bloom date, the helm outputs a probability band: "Block 4 Alphonso likely to begin panicle emergence between Feb 18 and Feb 25, 70% confidence." This band tightens as more sensor data accumulates, moving managers from guesswork to evidence-based scheduling.
The fourth layer is an action queue. Once a block clears the cool-period gate, the helm pushes recommended actions: paclobutrazol dosing (if not yet applied), flush-suppression sprays (if applicable), preventive copper for emerging panicles, and labor staging for emerging panicle care. Each action maps to a specific day based on the confidence band. The captain's order book stays in sync with the canopy's actual voyage.
The fifth layer is cross-block coherence. In a multi-block plantation, bloom dates cluster into waves. The helm surfaces the wave structure so you can plan spray rig rotations, picker deployments, and packing-house throughput accordingly. Instead of a single predicted bloom date, you see "wave 1: blocks 2, 4, 7 around Feb 18 to 22; wave 2: blocks 5, 8, 11 around Feb 26 to Mar 3; wave 3: blocks 3, 6, 9 around Mar 8 to 14." That structure is what your labor contractor, your spray vendor, and your export packer need to hear weeks in advance. Every week of advance notice is worth meaningful money in staged operations.
Frontiers Plant Science research on IoT smart sensors for precision agriculture shows how these humidity/temperature logging pipelines feed phenology timelines and disease prediction models in parallel. HarvestHelm runs these pipelines natively, so your flush-to-bloom timeline is never a standalone artifact, it is always a layer within the helm view that integrates with anthracnose pressure, powdery mildew risk, and labor logistics.
The kilo-cut pricing makes the investment adoptable for plantations of any size. No upfront hardware fees, no subscription charges, just a small share of the export-grade tonnage that the timeline helps you secure. If the timeline proves wrong and your season underperforms, HarvestHelm absorbs the cost alongside you. That alignment is why plantation managers who have been skeptical of SaaS agri-tech products find HarvestHelm easier to adopt: the only way we make money is if your export containers ship.
Advanced Tactics: Pressure-Testing the Timeline Across Blocks and Seasons
Three practices let the flush-to-bloom timeline compound in value across seasons.
First, block-level calibration. Each plantation block has quirks: slope-driven microclimate, soil moisture carry-over, irrigation routing, canopy density. HarvestHelm establishes per-block calibration factors over the first one or two seasons, tightening the confidence band on bloom predictions. A block that consistently blooms five days earlier than the plantation average gets that offset baked into future predictions. This is the orchard equivalent of a yacht's deviation card for the compass.
The calibration process also surfaces hidden correlations. Maybe Block 4 lags the plantation average during La Nina years but leads during El Nino years. Maybe Block 11 is sensitive to December-January rainfall in a way other blocks are not. These patterns emerge from the archived data, not from in-season observation alone. After three seasons, the helm's predictions for each block carry calibrated error bars that are substantially tighter than any generic bloom model. That accuracy is what supports confident export-contract negotiations.
Second, cross-referencing with monsoon mango flowering drift signals. Flush-to-bloom timelines that do not account for monsoon arrival drift produce confidently wrong answers during drift seasons. The helm reconciles monsoon arrival signatures with cool-period accumulators, so when the regional monsoon onset shifts, the flush-to-bloom timeline adjusts automatically.
Third, fungal pressure overlay. The same humidity data that drives flush-to-bloom phenology also drives fungal bloom windows. Running both pipelines on one dashboard means spray timing benefits from phenology context, and phenology predictions benefit from pathogen pressure context. This is the same fused-feed principle behind the canopy fungal windows that regional models routinely miss.
Fourth, treat the timeline as a conversation with your chemical supplier and labor contractor. Share a stripped-down version of the block-level emergence bands three weeks before flush, then update weekly as the helm tightens the bands. Suppliers can hold inventory, contractors can commit crews, and you avoid the last-minute premiums that kill margin during tight bloom windows. Operators who run this practice find that their bloom-season logistics costs drop noticeably, because the premium pricing that compensates suppliers for uncertainty stops flowing through their invoices.
A cross-crop parallel: apple operators in elevation-varied orchards time spring bloom off cold-air IoT probes that track cold-air drainage patterns invisible to valley stations. The principle translates directly to mango: the canopy, not the district, is where bloom physiology unfolds, and only hyperlocal humidity data captures the actual signal.
A fourth tactic, often overlooked, is archiving the timeline itself. Every bloom season, the helm stores the full timeline: block-level humidity, cool-period accumulation, initiation dates, emergence spreads, and final fruit counts. After three seasons of archived data, the plantation has an evidence base that supports hard decisions like which blocks to re-terrace, which canopy densities to manage more aggressively, and which cultivars to replace. The timeline is not just an operational tool; it becomes a strategic asset for capital planning.
CTA: Start Your Block-Level Timeline Before the Next Flush Cycle
If your Alphonso, Kesar, or Tommy Atkins blocks have bloomed inconsistently in recent seasons and you are running phenology off memory and calendar dates, HarvestHelm can deploy canopy-level humidity sensors and build the flush-to-bloom timeline for your next pre-monsoon flush. The dashboard flags cool-period gate status, projects panicle emergence bands, and queues labor actions day by day. Zero upfront charge. We take a share only when export-grade tonnage actually ships. Plantations running multi-block, multi-cultivar operations across Ratnagiri, Junagadh, or South Karnataka benefit from having a unified timeline rather than block-by-block guesswork.
Book a plantation walkthrough to map sensor placement before the next flush begins. Day one of the helm view shows cumulative cool-period hours per block against each cultivar's threshold, along with a three-wave bloom sequence projection that labor contractors and export packers can use to lock crews and shipping slots. Waitlist priority favors plantations tracking a 10-day-plus spread in panicle emergence between adjacent Alphonso and Kesar blocks, since these operations see the steepest timeline-accuracy gains. Schedule your sensor baseline at least five weeks before mature-leaf age crosses the seven-week floral competency threshold so the cool-period accumulator has uninterrupted hours feeding the confidence band.