Tracking Centimorgan Thresholds Across Multiple DNA Platforms
The Same Match, Three Different Numbers
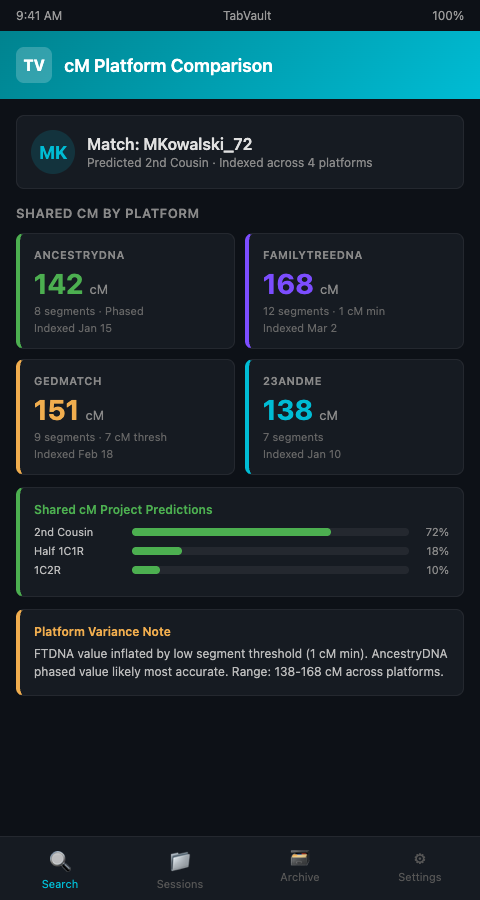
A genetic genealogist working an unknown parentage case tested her client on AncestryDNA, uploaded the raw data to FamilyTreeDNA and GEDmatch, and checked 23andMe results from a previous test. The same match -- the same biological cousin sharing the same DNA -- appeared on all four platforms with four different centimorgan values. On AncestryDNA, the match showed 142 cM. On FamilyTreeDNA, it showed 168 cM. On GEDmatch, it showed 151 cM. On 23andMe, it showed 138 cM.
This is not an error. The ISOGG Wiki on autosomal DNA match thresholds documents that each platform uses different minimum segment thresholds, different algorithms for detecting shared segments, and different methods for calculating total shared DNA. FamilyTreeDNA includes segments down to 1 cM, which inflates its totals compared to platforms with higher minimums. AncestryDNA uses phasing to improve accuracy, which other platforms do not. The result is that the same biological relationship produces different centimorgan numbers on different platforms.
For researchers running a multi-platform DNA match review, this creates a tracking problem. You cannot simply compare raw cM values across platforms without accounting for the platform-specific differences. A match at 168 cM on FamilyTreeDNA is not necessarily closer than a match at 142 cM on AncestryDNA -- the FamilyTreeDNA number is likely inflated by low-threshold segment inclusion. But keeping track of which number came from which platform, for dozens of matches across multiple platforms, overwhelms any manual system.
Building a Cross-Platform Centimorgan Archive
TabVault addresses this by indexing the match profile pages from every platform you visit. When you view a match on AncestryDNA, the profile page -- including the shared cM value, the predicted relationship, and the shared match list -- gets indexed. When you view the same match on FamilyTreeDNA, that page gets indexed too. Both pages are now in your searchable archive, linked by the match's name or username.
The practical value is immediate. Search your archive for a match's name, and you see every platform's assessment side by side. The centimorgan threshold tracking happens automatically because each platform page displays its cM value in the indexed content. You do not need to manually enter numbers into a spreadsheet. The data is already captured in the context where it was generated -- the platform's own match page.
This approach turns chaotic browser sessions into a searchable private database specifically tuned for DNA match centimorgan comparison. The match's AncestryDNA profile from January and their FamilyTreeDNA profile from March both surface in the same search, giving you a complete multi-platform view of every match you have reviewed.
Researchers who are already integrating tab search into their genetic genealogy workflow will find that centimorgan tracking is a natural byproduct of that integration. Every match page you visit as part of your normal workflow gets indexed, and the cM values ride along with the rest of the page content.
Interpreting Cross-Platform Discrepancies
Not all platform discrepancies are equal. Understanding why the numbers differ helps you interpret what the numbers mean.
FamilyTreeDNA centimorgan analysis quirks. FamilyTreeDNA's low segment threshold (1 cM minimum) means it reports more total shared DNA than other platforms. The National Human Genome Research Institute defines a centimorgan as a unit of genetic linkage where one cM equals a one percent chance that two markers on a chromosome will be separated by recombination in a single generation, with one cM corresponding to roughly one million base pairs on average. Because FamilyTreeDNA includes smaller segments that other platforms discard, its reported cM totals are consistently higher for the same biological relationship. When your archive shows a match with higher cM on FamilyTreeDNA than AncestryDNA, that discrepancy is expected and should not alter your relationship prediction.
AncestryDNA's phasing advantage. AncestryDNA is the only major platform that uses phasing with parental data to assign alleles to maternal and paternal chromosomes. This produces more accurate shared DNA measurements but can result in lower cM totals than unphased platforms. When AncestryDNA reports a lower number, it may actually be the most accurate one.
GEDmatch's adjustable thresholds. GEDmatch lets you set your own minimum segment threshold. Running the same comparison with different thresholds produces different totals. Index each result page with its threshold setting so you can compare like with like. A GEDmatch comparison at 7 cM minimum is not comparable to one at 3 cM minimum.
The Shared cM Project as the common reference. DNA Painter's Shared cM Project tool, based on nearly 60,000 known relationships, provides probability distributions for each relationship type. When you have multiple cM values for the same match, enter each into the Shared cM Project tool and index the result pages. The overlap in predicted relationships across platforms narrows the possibilities. Researchers who also track cross-referencing across multiple species dosing data face a similar challenge of normalizing measurements across different data sources.
Advanced Tactics for Shared Centimorgan Data Organization
Build a platform comparison baseline. Before you start intensive match research, pick three to five matches who appear on all your platforms. Index their profile pages on every platform. These known-quantity matches become your calibration set. When you see a new match at 180 cM on FamilyTreeDNA, you can search your archive for your calibration matches and see how much FamilyTreeDNA typically inflates compared to AncestryDNA for similar-range matches.
Flag threshold-sensitive matches. Matches near platform display thresholds deserve special attention. AncestryDNA's minimum display threshold is 8 cM. A match at 9 cM on AncestryDNA might not appear on your 23andMe results if 23andMe's algorithm filters it differently. When you notice a match that appears on one platform but not another, document both the presence and the absence in your indexed sessions. The absence is evidence too.
Track cM changes over time. Platforms occasionally update their algorithms, and shared cM values can change. AncestryDNA's 2020 matching update significantly altered many users' match lists. If you indexed match profile pages before and after such an update, your archive contains a record of how specific matches' cM values changed -- valuable context for interpreting older research against current data.
Account for phased versus unphased data. When one or both of the individuals in a comparison have a parent who also tested, the platform can phase the data and assign each allele to the correct parent. Phased comparisons are more accurate and typically yield lower cM totals because false positive segments are eliminated. Index the match page along with a note about whether the comparison involved phased data. A phased comparison at 120 cM carries more analytical weight than an unphased comparison at 140 cM, and your archived sessions should capture that distinction.
Use cM patterns to inform DNA cluster analysis. Matches within the same cluster should show roughly consistent cM ranges (adjusted for platform differences). If your blue cluster contains matches between 80 and 200 cM on AncestryDNA but one match shows 350 cM, that outlier may belong to a different generation or a different line entirely. Your indexed sessions let you pull up the specific match pages to investigate.
Reconcile GEDmatch data with GEDmatch discoveries researchers forget to save. GEDmatch results are particularly prone to loss because the platform does not maintain a persistent match history the way AncestryDNA does. Indexing your GEDmatch result pages as you view them creates the persistent record the platform itself does not provide.
If you are tracking DNA matches across AncestryDNA, FamilyTreeDNA, 23andMe, and GEDmatch, your centimorgan data is scattered across platforms that each measure differently. TabVault consolidates every match page into one searchable archive where cross-platform comparison happens through search, not spreadsheets. Join the waitlist to bring order to your multi-platform DNA match review.