Detecting Seasonal Toxin Patterns Through Indexed Research History
The Calendar Hides in Your Browser History
Three days after Easter 2024, an emergency veterinary clinic in Portland, Oregon, treated its fourth cat for lily toxicosis in 72 hours. The attending veterinarian, Dr. Kim, recognized the cluster because she happened to be on duty for all four cases. But her clinic had no system to flag the pattern automatically. If those four cats had been seen by four different clinicians across three shifts, the cluster would have been invisible — four isolated cases instead of a recognizable surge.
Lily poisoning in cats is not a surprise. The ASPCA Animal Poison Control Center consistently reports lilies among the top toxic plant exposures in felines, and the Pet Poison Helpline confirms that true lilies (Lilium and Hemerocallis species) cause acute kidney failure with as little as two petals or a small amount of pollen. The seasonal poisoning trend is well-established in the literature: Easter and Mother's Day trigger predictable spikes in lily exposures because of increased flower purchases. Yet most clinics respond to each case individually, with no mechanism to connect this week's lily cases to last April's lily cases.
The same pattern repeats across the calendar. Chocolate toxicosis in dogs peaks during Halloween, Thanksgiving, and Christmas. The Veterinary Poisons Information Service (VPIS) in the United Kingdom documented a fourfold increase in chocolate exposure calls during the Christmas period compared to non-holiday months. Rodenticide cases climb in autumn when homeowners prepare for winter. Antifreeze (ethylene glycol) exposures spike when temperatures drop and radiators get flushed. Spring plant toxicity surges follow predictable planting seasons. Every emergency clinic experiences these seasonal poisoning trends, but few track them systematically.
From Reactive Treatment to Proactive Detection
The raw data for seasonal toxin pattern detection already exists — it is scattered across months of browser history. Every time a clinician researches a toxin exposure, they generate a trail of indexed pages: ASPCA toxin profiles, dosing calculators, VIN discussion threads, PubMed case reports. That trail, properly captured and searchable, becomes an analytical dataset.
TabVault captures this trail automatically. When Dr. Kim researches lily toxicosis in April, the full text of every page she visits gets indexed locally — the ASPCA lily page, the Merck Veterinary Manual entry on nephrotoxic plants, the VIN thread about decontamination timing. When Dr. Hassan researches chocolate toxicosis in December, his research gets the same treatment. Over a full calendar year, the practice's indexed research history becomes a proxy for its caseload and case research patterns.
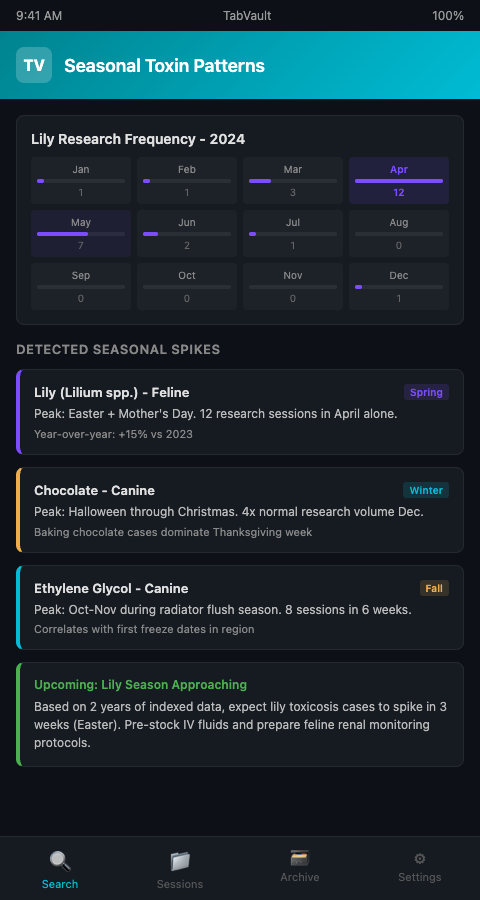
The detection mechanism is simple: search frequency over time. If the term "lily" appears in indexed pages three times in March, twelve times in April, and twice in May, the seasonal spike is visible in the data. You do not need a specialized analytics platform. You need a searchable archive with timestamps — the foundation of turning chaotic browser sessions into a searchable private database where every session carries a date.
Holiday toxin exposure patterns become especially clear in indexed research history. A search for "chocolate theobromine" filtered to December across two years of data reveals the exact week when cases peak, which chocolate types the clinic encounters most often (baking chocolate versus milk chocolate versus cocoa mulch), and which treatment protocols the team has relied on. This is seasonal animal poisoning analytics built from actual clinical research rather than abstract national statistics.
TabVault's date-range search makes this analysis straightforward. Select a three-week window around Easter, search for "lily" or "renal" or "Hemerocallis," and review every page your team indexed during that period. Compare with the same window from the prior year. The pattern either confirms or challenges your assumptions about spring plant toxicity surge tracking at your specific practice.
The value is not just retrospective. Once you know that your clinic consistently sees a rodenticide spike in the first two weeks of November, you can prepare: pre-stock vitamin K1, brief incoming shift clinicians, even send client education materials to your patient base. The cluster detection capability that comes from indexed history turns seasonal awareness from folklore into actionable intelligence.
Advanced Seasonal Analysis Tactics
Build a toxin calendar from indexed data. At the end of each quarter, run searches for the ten most common toxins your practice encounters. Record the frequency of research sessions involving each toxin by month. After a full year, you have a practice-specific toxin calendar that reflects your local patient population, not just national averages. A clinic near a neighborhood with heavy Easter lily planting has a different profile than one near agricultural land with rodenticide use year-round.
Correlate seasonal patterns with geographic data. If your indexed history includes pattern detection across multiple data sources, you can layer geographic context onto seasonal trends. Three antifreeze cases in the same ZIP code in October is different from three cases scattered across the metro area. The indexed research tells you what the team was investigating; case records tell you where the patients came from. Combined, they identify neighborhood-level seasonal risks.
Track year-over-year trend shifts. Spring plant toxicity surge tracking over multiple years reveals whether certain toxins are becoming more or less frequent in your practice area. If sago palm toxicosis cases have doubled each spring for three consecutive years, that trend likely reflects local landscaping changes and warrants a targeted client education campaign.
Use search gaps as signals. The absence of research on a known seasonal toxin can be as informative as its presence. If your indexed history shows zero rodenticide research in November, it might mean your practice area has low rodenticide use — or it might mean cases are being treated from memory without fresh research. Both interpretations are useful for clinical quality review.
Share seasonal intelligence at staff meetings. Presenting seasonal poisoning trends veterinary data from the indexed archive during monthly staff meetings grounds the discussion in your practice's own experience. New team members learn what to expect, and experienced clinicians confirm or update their mental models with actual data.
Pre-position antidote inventory based on indexed patterns. Pet Poison Helpline's AVMA seasonal pet hazard data report confirmed that over-the-counter medications, chocolate, and rodenticides remain among the most common exposure categories year after year, with bromethalin rodenticide rising from fifth to third place in 2024. When your archive shows that vitamin K1 demand spikes every November due to rodenticide cases, and N-acetylcysteine usage clusters around the winter holiday season when cats encounter acetaminophen in dropped medications, those patterns directly inform pharmacy stocking decisions. Rather than maintaining a static inventory year-round, practices can adjust antidote supplies based on the seasonal cadence their own research history reveals. A practice that indexed three years of research sessions can forecast antidote demand with far greater precision than one relying on national averages or vendor recommendations.
Coordinate seasonal client education campaigns. The same indexed data that reveals internal research patterns can drive external communication. If your archive shows a surge in lily-related research every March, launch a client education campaign in late February — social media posts, exam room posters, email newsletters — warning cat owners about lily toxicity before Easter flower purchases begin. The indexed research history provides the evidence base for timing these campaigns to match your practice's actual exposure calendar rather than generic seasonal advice.
Your Caseload Is Already Telling You What Is Coming
Seasonal toxin patterns repeat year after year, but most clinics rediscover them one emergency at a time. TabVault's indexed research history makes those patterns visible, searchable, and actionable — turning months of browser-based clinical research into a seasonal intelligence system. Join the waitlist to start building the archive that shows you what your next season will bring.
Chocolate cases spike every December, lily poisonings surge every April, and your indexed research archive makes those patterns visible instead of anecdotal. TabVault timestamps every page you index, so filtering your archive by date range reveals exactly when your team researched each toxin class and how frequently. After a full calendar year, you have a practice-specific toxin calendar built from actual clinical data — not national averages, but the precise seasonal cadence of exposures in your patient population. Use that intelligence to pre-stock antidotes, time client education campaigns, and brief incoming clinicians before predictable seasonal surges arrive.